Tools of Financial Analysis - 2 | Commerce & Accountancy Optional Notes for UPSC PDF Download
| Table of contents |

|
| Coverage Ratios |

|
| Dupont Model of Financial Analysis |

|
| Uses of Ratio Analysis |

|
| Limitations of Ratio Analysis |

|
| Conclusion |

|
Profitability in Relation to Capital Employed (Investment)
Profitability ratio, as stated earlier, can also be computed by relating profits to capital or investment. This ratio is popularly known as Rate of Return on Investment (ROI). The term investment may be used in the sense of capital employed or owners’ equity. Two ratios are generally calculated:
(i) Return on Capital Employed (ROCE)
The ratio establishes the relationship between total capital and net operating profit of the business. The purpose of this ratio is to find out whether capital employed is effectively utilised or not. The formula for calculating Return on Capital Employed is:

The term "Net Operating Profit" refers to the profit before interest and tax. "Interest" specifically pertains to the interest incurred on long-term borrowings, whereas interest on short-term borrowings is deducted from operating profit calculations. Additionally, non-trading incomes, such as income from external investments, and non-trading losses or expenses are excluded when determining profit.
The concept of "capital employed" varies among accountants, but three widely accepted definitions are as follows:
- Gross Capital Employed = Fixed Assets + Investments + Current Assets
- Net Capital Employed = Fixed Assets + Investments + Net Working Capital (Current Assets minus Current Liabilities)
- Sum Total of Long-term Funds = Share Capital + Reserves and Surpluses + Long-term Loans minus Fictitious Assets and Non-business Assets.
In managerial decisions, "capital employed" generally aligns with the definition provided in the third point above.
The return on capital employed ratio holds significant importance as it reflects the overall efficiency of the firm. A higher ratio indicates a greater return on the long-term funds invested in the firm, demonstrating effective capital utilization. However, establishing a standard ratio for return on capital employed is challenging due to various factors such as business risk, industry nature, and economic conditions. Depending on the intended purpose, this ratio may be complemented by additional ratios.
Return on Investment (ROI)
When you are asked to find out the profitability of the Company from the share holders’ point of view, Return on Investment should be Computed as follows:

The term ‘Net Profit’ means ‘Net Income after Interest and Tax’. This is because the shareholders are interested in Total Income after Tax including Net nonoperating income.
From illustration 5, Net profit after interest and tax will be Rs. 1,00,000 and Return on Investment will be 20% i.e. 
(i) Return on Shareholders’ Equity
This ratio shows the relationship between net profit after taxes and Shareholders’ equity. It reveals the rate of return on owners’/shareholders’ funds. The term shareholders’ equity is also known as ‘net worth’ and includes Equity Capital, Share Premium and Reserves and Surplus. The formula of this ratio is as follows:

Illustration: From the following Balance Sheet find Return on Shareholders’ Equity.
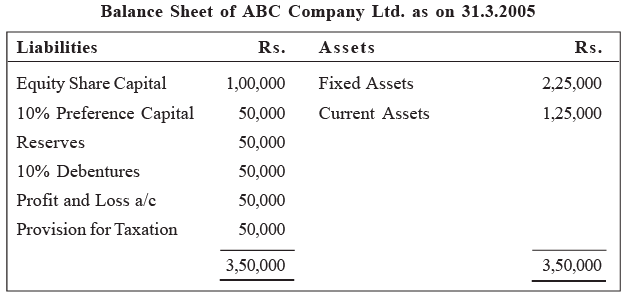
Solution:

Net profit after, tax and prefence Dividend
= Rs. 45,000
Shareholders’ equity = Equity capital + Reserves + Profit and Loss account
= Rs. 1,00,000 + 50,000 + 45,000
= Rs. 1,95,000

= 23%
The higher the ratio, the greater is the efficiency of the firm in generating profits on shareholders’ equity and vice versa. The ratio is very important for the investors to judge whether their investment in the firm generates a reasonable return or not.
This ratio is important to the management as it proves their efficiency in employing the funds profitably.
Earnings Per Share
Earnings per Share (EPS) is an important ratio from equity shareholders’ point of view as this ratio affects the market price of share and the amount of dividend to be given to the equity shareholders. The earnings per share is calculated as follows:

Illustration: From the following information calculate Earnings per Share of X Company Ltd. :
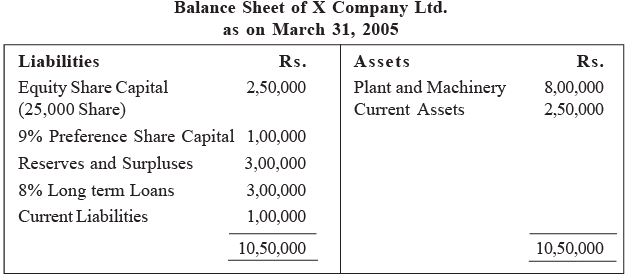
The net profit before interest and after Tax was Rs. 78,000.
Solution:
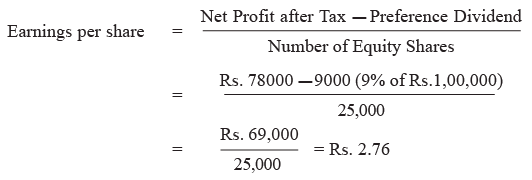
The Earnings Per Share is useful in determining the market price of equity share and capacity of the company to pay dividend. A comparison of earning per share with another company helps to know whether the equity capital is effectively used in the business or not.
Activity Analysis Ratios
Activity Analysis Ratio may be studied under the following three heads:
- Assets Turnover Ratio,
- Accounts Receivable Turnover Ratio, and
- Inventory Turnover Ratio.
Assets Turnover Ratio
The asset turnover ratio simply compares the turnover with the assets that the business has used to generate that turnover. In its simplest terms, we are just saying that for every Re. 1 of assets, the turnover is Rs. x. The formula for total asset turnover is:

Asset turnover is meant to measure a company’s efficiency in using its assets. The higher a company’s asset turnover, the lower its profit margin tends to be and visa versa.
Accounts Receivable Turnover Ratio
- The debtor turnover ratio indicates the average time it takes your business to collect its debts. It’s worth looking at this ratio over a number of financial years to monitor performance trends.
- Use information from your annual Profit and Loss Statement along with the trade debtors figure from your Balance Sheet for that financial year to calculate this ratio.
- A ratio that is lengthening can be the result of some debtors slowing down in their payments. Economic factors, such as a recession, can also influence the ratio.
- Tightening your business’ credit control procedures may be required in these circumstances.
- The debtor ageing ratio has a strong impact on business operations particularly working capital. Maintaining a running total of your debtors by ageing (e.g. current, 30 days, 60 days, 90 days) is a good idea, not just in terms of making sure you are getting paid for the work or goods you are supplying but also in managing your working capital.
The calculation used to obtain the ratio is:

Inventory Turnover Ratio
- The inventory turnover ratio indicates how quickly your business is turning over stock.
- A high ratio may indicate positive factors such as good stock demand and management. A low ratio may indicate that either stock is naturally slow moving or problems such as the presence of obsolete stock or good presentation. A low ratio can also be indicative of potential stock valuation issues. It is a good idea to monitor the ratio over consecutive financial years to determine if a trend is developing.
- It can be useful to compare this financial ratio with the working capital ratio. For example, business operations with low stock turnover tend to require higher working capital.
The calculation used to obtain the ratio is:

Average Inventories = (Beginning Inventories + Ending Inventories) ÷ 2
Long-term Solvency Ratios
The long-term solvency ratios are calculated to assess the long-term financial position of the business. These ratios are also called leverage, or capital structure ratios, or capital gearing ratios. The following ratios generally come under this category:
(i) Debt-Equity Ratio/Total Debt Equity Ratio
- It shows the relationship between borrowed funds and owner’s funds, or external funds (debt) and internal funds (equity). The purpose of this ratio is to show the extent of the firm’s dependence on external liabilities or external sources of funds.
- In order to calculate this ratio, the required components are external liabilities and owner’s equity or networth. ‘External liabilities, include both long-term as well as short-term borrowings. The term ‘owners equity’ includes past accumulated losses and deferred expenditure. Since there are two approaches to work out this ratio, there are two formulas as shown below :
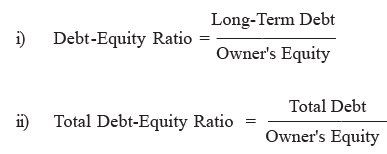
In the first formula, the numerator consists of only long-term debts, it does not include short-term obligations or current liabilities for the following reasons :
- Current liabilities are of a short-term nature and the liquidity ratios are calculated to judge the ability of the firm to honour current obligations.
- Current liabilities vary from time to time within a year and interest thereon has no relationship with the book value of current liabilities.
In the second formula, both short-term and long-term debts are counted in the numerator. The reasons are as follows :
- When a firm has an obligation, no matter whether it is of short-term or long-term nature, it should be taken into account to evaluate the risk of the firm.
- Just as long-term loans have a cost, short-term loans do also have a cost.
- As a matter of fact, the pressure from the short-term creditors is often greater than that of long-term loans.
Illustration: From the following Balance Sheet of Kavitha Ltd., Calculate Debt Equity Ratio :
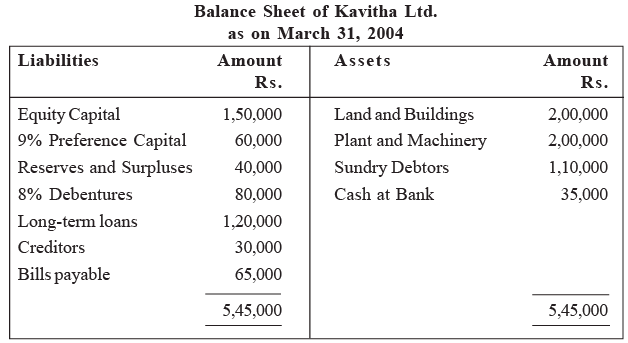
Solution:
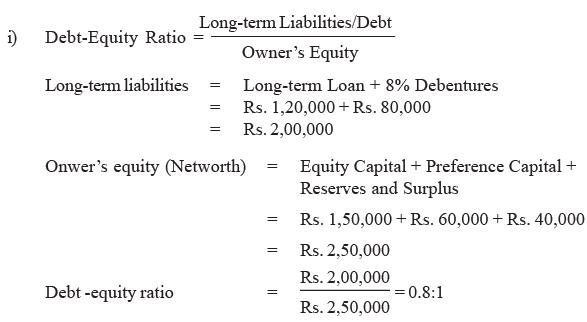
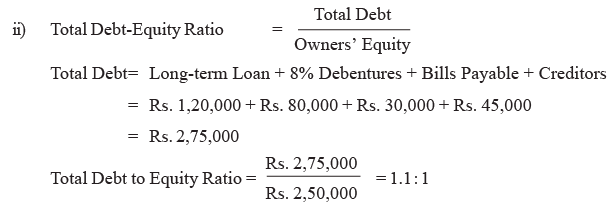
- When analyzing the capital structure, the debt-equity ratio provides insight into the proportion of funds contributed by external sources compared to owners invested in the business. Typically, a long-term debt to equity ratio of 2:1 is considered prudent. Exceeding this ratio may strain the firm's ability to fulfill obligations to external stakeholders. A higher ratio amplifies risk, as the firm must service interest payments regardless of profitability. Conversely, a lower ratio implies lower risk, offering creditors a greater safety buffer.
- The ideal ratio varies based on the enterprise's characteristics and prevailing economic conditions. In periods of prosperity, a higher ratio may be advantageous, while during downturns, a lower ratio is preferable. In India, the Controller of Capital Issues recommends a 2:1 ratio as the standard for this measure.
ii) Proprietory Ratio
- This ratio is also known as Equity Ratio or Networth to Total Assets Ratio. It is a variant of Debt-Equity Ratio, and shows the relationship between owners’ equity and total assets of the firm. The purpose of this ratio is to indicate the extent of owners’ contribution towards the total value of assets. In other words, it gives an idea about the extent to which the owners own the firm.
- The components required to compute this ratio are proprietors’ funds and total assets. Proprietors’ funds include equity capital, preference capital, reserves and undistributed profits. If there are accumulated losses they are deducted from the owners’ funds. ‘Total assets’ include both fixed and current assets but exclude fictitious assets, such as preliminary expenses; debit balance of profit and loss account etc. Intangible assets, if any, like goodwill, patents and copy rights are taken at the amount at which they can be realised . The formula of this ratio is as follows :

Taking the information from Illustration 3, the Proprietory Ratio can be calculated as follows :

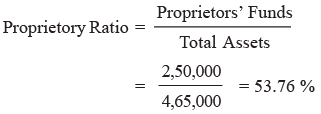
There isn't a fixed standard for this ratio. Some financial experts suggest that proprietor's funds should comprise 67% to 75%, while outsiders' funds should make up 25% to 33% of total assets. A higher ratio indicates less reliance on external funds. In such cases, the firm isn't utilizing external funds to their fullest potential, which could maximize returns on proprietor's funds. For example, if a firm earns a 20% return on borrowed funds with a 10% interest rate, shareholders could benefit from a 10% return on external funds, increasing their earnings.
(iii) Capital Gearing Ratio
- This ratio assesses the balance between equity share capital and fixed-interest and dividend-bearing funds, excluding current liabilities. Its purpose is to determine an optimal mix of equity capital and fixed-interest-bearing sources.
- To calculate this ratio, we need the values of (i) equity share capital including reserves and surpluses, and (ii) preference share capital, along with fixed-rate interest-bearing sources like debentures, public deposits, long-term loans, etc.
The formula for this ratio is:

Coverage Ratios As mentioned earlier, leverage ratios are computed both from Balance Sheet and Income Statement (Profit and Loss Account). Under Section 5.6.5 of this Unit Long term Solvency Ratio you have studied the ratios computed from Balance Sheet. Let us now discuss the second category of leverage ratios to be calculated from Income Statement. These ratios are called ‘Coverage Ratios’.
Coverage Ratios
As mentioned earlier, leverage ratios are computed both from Balance Sheet and Income Statement (Profit and Loss Account). Let us now discuss the second category of leverage ratios to be calculated from Income Statement. These ratios are called ‘Coverage Ratios’.
In order to judge the solvency of the firm, creditors assess the firm’s ability to service their claims. In the same manner, preference shareholders evaluate the firm’s ability to pay the dividend. Theses aspects are revealed by the coverage ratios. Hence, these ratios may be defined as the ratios which measure the ability of the firm to service fixed interest bearing loans and other fixed charge securities. These ratios are:
(i) Interest Coverage Ratio
This ratio is also known as ‘times interest earned’ ratios. It is used to assess the firm’s debt servicing capacity. It establishes the relationship between Net Profit or Earnings before interest and Taxes (EBIT). The purpose of this ratio is to reveal the number of times that the Interest charges are covered by the Net Profit before Interest and Taxes. The formula for this ratio is as follows:

Illustration: The Net Profit after Interest and Taxes of a firm is Rs. 98,000. The interest and taxes paid during the year were Rs. 16,000 and Rs. 30,000 respectively. Calculate Interest Covereage Ratio.
Solution:
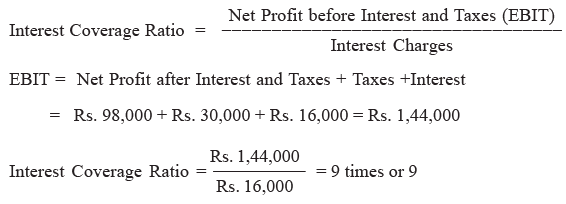
In the provided example, the interest coverage ratio stands at 9. This suggests that even if the firm's profit decreases to 1/9th of its current level, it would still be capable of meeting its interest obligations. Therefore, a higher ratio serves as an assurance to creditors regarding the firm's ability to fulfill its financial commitments. However, an excessively high ratio may indicate a conservative approach by the firm towards debt utilization. Conversely, a low ratio suggests an overreliance on debt. Hence, it's essential for a firm to maintain a comfortably high coverage ratio to establish its creditworthiness in the market.
(ii) Dividend Coverage Ratio
This ratio illustrates the relationship between Net Profit and Preference dividend. Net profit refers to the profit remaining after deducting interest and taxes but before paying preference dividends. The objective of this ratio is to demonstrate how many times preference dividends are covered by Net Profit after Interest and Taxes. To calculate this ratio, the following formula is applied:

(iii) Total Coverage Ratio
- Also known as ‘Fixed Charge Coverage Ratio’. This ratio examines the relationship between Net Profit Before Interest and Taxes (EBIT) and Total Fixed Charges. The purpose of this ratio is to show the number of times the total fixed charges are covered by Net Profit before Interest and Taxes.
- The components of this ratio are Net Profit Before Interest and Taxes (EBIT) and Total Fixed Charges. The Fixed Charges include interest on loans and debentures, repayment of principle, and preference dividend. It is calculated as follows:

Dupont Model of Financial Analysis
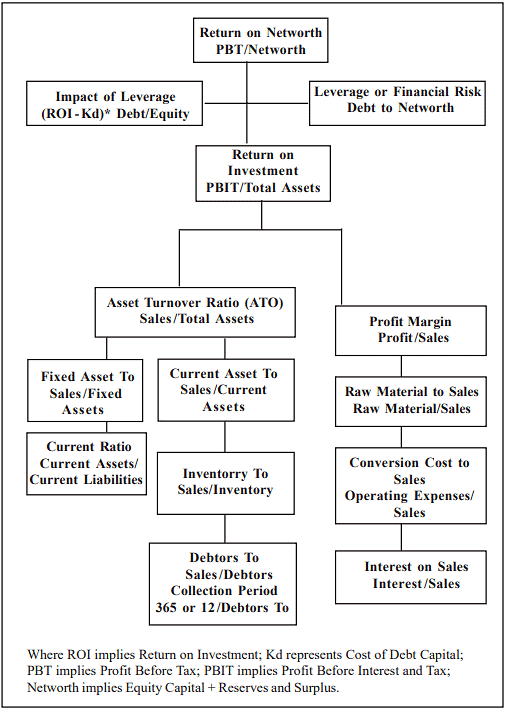
- While ratio analysis helps to a great extent in performing the financial statement analysis, most of the time, one would be left in confusion with umpteen ratio calculation in hand. Hence one has to have a guided and structured form of ratio analysis to get a complete picture of the overall performance and risk of the company in a nut shell. This was made possible by the company DuPont. This company had given a structured form of doing financial statement analysis for the first time and from here on most analysts started using the technique.
- The DuPont System of Analysis merges the income statement and balance sheet into two summary measures of profitability: Return on Assets (ROA) and Return on Equity (ROE). The system uses three financial ratios to express the ROA and ROE: Operating Profit Margin Ratio (OPM), Asset Turnover Ratio (ATR), and Equity Multiplier (EM).
The DuPont chart analysis has been explained with an example below.
- To understand the Dupont analysis better, it’s better to condense the income statement and balance sheet data in a required format as given below. The following table gives the balance sheet and income statement of Asian Paints for the year ending March 2001 and March 2002.
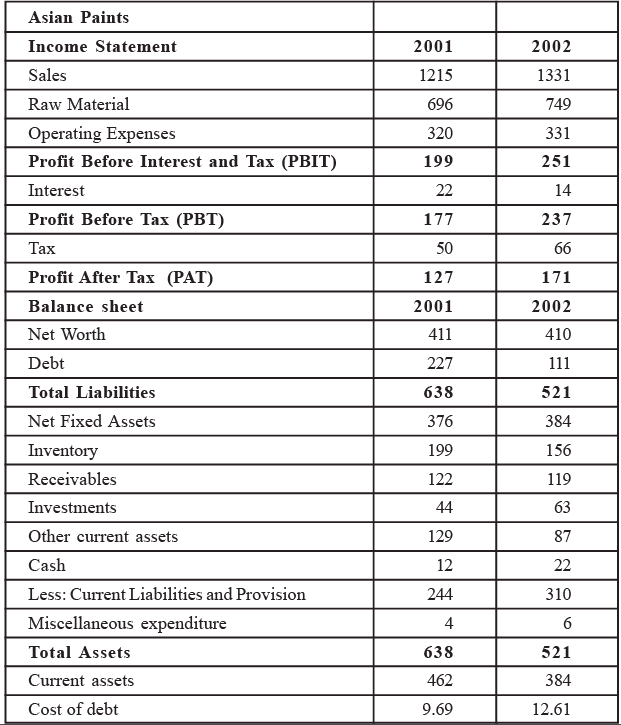
DuPont Chart Financial Statement Analysis (Template)
- The aforementioned analysis serves as a notable illustration of time series analysis, involving the comparison of a company's financial statements across multiple years. The findings suggest that Asian Paints exhibited commendable performance in the year 2002. It is imperative to delve deeper into the factors contributing to this positive performance. Notably, the Return on Assets (ROA) or Return on Investment (ROI) surged from 31% to 48%, attributed to the combined favorable impact of the profit margin and asset turnover ratios.
- During 2002, the company managed to elevate its profit margin from 16% to 18%, primarily by reducing expenses related to raw materials, conversion, and interest. Moreover, Asian Paints demonstrated enhanced efficiency in asset utilization, as evidenced by improvements in overall asset turnover ratio, along with increases in current and fixed asset turnover ratios, as well as inventory turnover ratio.
DuPont Chart Financial Statement Analysis of Asian Paints
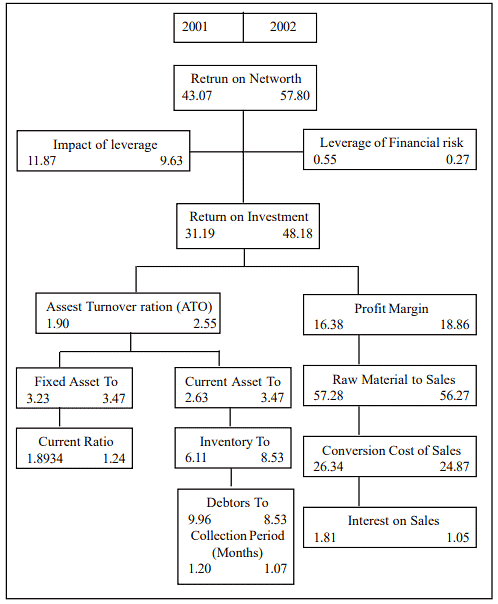
The debtors turnover ratio has shown improvement, indicating that the company is managing its receivables more efficiently. This is further evidenced by the reduced credit period extended to customers, which decreased from 1.2 to 1.07 during 2002.
- Additionally, the company experienced a favorable impact from its leverage strategy. Although the debt equity mix decreased in 2002, it still had a positive effect, resulting in a 9% increase in returns to shareholders. Consequently, the Return on Equity (ROE) rose to 57% from 43% in 2001. A comparison of Asian Paints' performance with industry averages reveals exceptionally promising results, indicating superior performance compared to industry peers.
Inter-Firm Comparison (Cross-Section Analysis)
- While the aforementioned analysis provides insights into the firm's performance over time, it may not suffice alone. Comparing the company's performance with its counterparts becomes imperative. This entails evaluating whether Asian Paints has outperformed the industry average or has excelled relative to competitors within the same industry.
- This type of analysis is particularly valuable when conducting industry analysis, especially in industries where the company under scrutiny is not a monopoly. Understanding why the company has either underperformed or outperformed its competitors is essential. Such analysis aids analysts in forecasting the company's future market share, profitability, and sustainable growth rate in a competitive environment.
 |
Download the notes
Tools of Financial Analysis - 2
|
Download as PDF |
Uses of Ratio Analysis
Ratio analysis is used as a device to analyse and interpret the financial strength of the enterprise. With the help of these ratios Financial statements can be analysed and interpreted more clearly and conclusions can be drawn about the performance of the business. The importance of a ratio analysis is widely recognised on account of its usefulness as outlined below:
- It conveys inter-relationship between different items of the financial statements: Since the ratios convey the inter-relationship between different items of the Balance Sheet and Profit and Loss account, they reflect the financial state of affairs and efficiency of operations more clearly than the absolute accounting figures. For example, the net profit earned by a firm may appear to be quite satisfactory if the amount of profit is large, say Rs. 5 Lakh.
But, the profit earned can not be regarded good unless it is ralated to the total investment. If the capital invested is say Rs. 2 crore, the amount of profit expressed as a percentage of investment comes to be only 2.5%. This cannot be said to be satifactory performance. However, if the capital invested was Rs. 50 Lakh, profit earned would be 10% of the capital investment which may be considered reasonably good. - Helps to judge the performance of the business: Efficiency of performance of management and the overall financial position are revealed by means of financial ratios which may not be otherwise apparent from a set of accounting figures. The index of efficiency reflected in the ratios can be used as the basis of management control. The trend of ratios over a period of time can also be used for planning and forecasting purposes.
- Enables comparison between firms and divisions: Ratio analysis offers the necessary data for comparing the performance of various firms within the same industry, as well as different divisions within a firm. This comparison allows meaningful conclusions to be drawn regarding whether the firm's performance is improving or declining, aiding in making informed investment decisions.
- Assessing creditworthiness: Ratio analysis reveals crucial information about the firm's creditworthiness, including its earning capacity, ability to service debt and interest, growth prospects, and similar factors. Creditors, financiers, investors, and shareholders rely on ratio analysis to assess the financial condition and performance of the firm.
- Government utility: Government entities utilize the financial statements published by industrial units to compute ratios for assessing both short-term and long-term financial positions of firms. These financial ratios serve as indicators of the overall financial strength of the industrial sector, aiding government decision-making processes.
Limitations of Ratio Analysis
Before delving into the practical application of ratio analysis, it's crucial to acknowledge and understand its limitations. Here are some key points to consider:
- Diversification across industries: Many companies, such as L&T, HLL, and P&G, operate in multiple business segments. Therefore, it's essential to ensure that segment-level ratios are compared appropriately.
- Impact of inflation: Inflation can distort balance sheets, as financial statements often do not adjust for inflation, presenting an inaccurate picture. However, moderate inflation may have minimal effects on the analysis.
- Influence of seasonal factors: Seasonal variations can significantly impact ratios. It's advisable to control for these differences by conducting ratio analysis on a quarterly basis for a comprehensive view.
- Risk of window-dressing: Accounting scandals highlight the risk of window-dressing or creative accounting practices. While small investors may have limited control over this, it's essential to remain vigilant for any discrepancies in accounting practices.
- Varied accounting practices: Different companies within the same industry may employ different accounting methods, making comparisons challenging. Adjustments should be made to account for these differences.
- Varied fiscal years: Companies may use different fiscal years, complicating comparisons. Careful adjustments should be made to compare financial data accurately.
- Impact of company age: The age of a company can distort ratios, as established firms may have different financial metrics compared to newer entrants. Similarities among companies being compared should be considered.
- Influence of innovation and aggressiveness: Innovation and aggressive strategies may lead to unconventional or "bad" ratios. It's essential to understand the underlying reasons behind such ratios before drawing conclusions.
- Appropriateness of benchmark ratios: Industry averages may not always be suitable benchmarks for comparison. Careful selection of benchmark ratios is necessary, considering industry dynamics and specific company circumstances.
- Contextual interpretation of ratios: Ratios should not be interpreted in isolation, as higher ratios may not always indicate better performance. Future performance cannot be guaranteed based solely on past ratios, as various factors may influence outcomes from year to year.
Conclusion
- Financial statements serve as comprehensive summaries of financial information, prepared in accordance with relevant standards for utilization by both managers and external stakeholders. The primary purpose of financial reports is to communicate the financial status of a company to its external shareholders.
- Various user groups of financial statements have distinct interests in different aspects of a company's financial activities. Short-term creditors prioritize the company's capability to meet immediate cash obligations, focusing on operating cash flows and current assets and liabilities. Long-term creditors, conversely, are concerned with the company's long-term ability to fulfill interest and principal payments, considering broader financial indicators beyond short-term liquidity. Common stockholders generally focus on dividend payouts and the market value of their investments, albeit individual interests may vary.
- Comparative financial analysis, which involves assessing relationships among specific financial items, is integral to financial statement analysis. By presenting financial information for multiple time periods, companies enable users to discern changes over time. Absolute value comparisons, percentage changes, trend percentages, component percentages, and ratios are essential tools for making such comparisons within and across accounting periods.
- The assessment of information quality is crucial in financial statement analysis, considering companies' discretion in selecting accounting methods within generally accepted accounting principles. The choice of accounting principles and methods, aimed at long-term company interests despite potential short-term impacts on net income or total assets, contributes to high-quality financial reporting.
- To enhance the utility of financial accounting information, it is often compared with other relevant data. Net income, a key measure of financial performance, gains further significance when analyzed in conjunction with sales, assets, and stockholders' equity. Ratio analysis, a significant tool, involves mathematical calculations that compare various financial statement items to facilitate decision-making.
- Ratios provide context by comparing financial statement items either within the same statement or across different statements. Accountants and financial analysts have developed numerous ratios to aid in understanding a company's financial position and support decision-making processes.
- Ratio analysis is often structured using models like the DuPont model, offering investors a comprehensive and meaningful assessment of a company's financial position.
|
180 videos|153 docs
|
FAQs on Tools of Financial Analysis - 2 - Commerce & Accountancy Optional Notes for UPSC
| 1. What are the coverage ratios in financial analysis? |  |
| 2. How does the Dupont Model of Financial Analysis work? |  |
| 3. What are some common uses of ratio analysis in financial analysis? |  |
| 4. What are some limitations of ratio analysis? |  |
| 5. How can financial analysis tools help in making investment decisions for UPSC exam preparation? |  |


