


All Exams >
Mechanical Engineering >
Engineering Mathematics for Mechanical Engineering >
All Questions
All questions of Probability and Statistics for Mechanical Engineering Exam
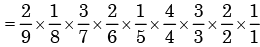
A fair coin is tossed 10 times. What is the probability that ONLY the first two tosses will yield heads? - a)

- b)

- c)

- d)
Correct answer is option 'C'. Can you explain this answer?
A fair coin is tossed 10 times. What is the probability that ONLY the first two tosses will yield heads?
a)
b)
c)
d)
|
|
Rhea Reddy answered |
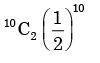
Let A be the event that first toss is head
And B be the event that second toss is head.
By the given condition rest all 8 tosses should be tail
∴ The probability of getting head in first two cases

A fair dice is rolled twice. The probability that an odd number will follow an even number is - a)1/2
- b)1/6
- c)1/3
- d)1/4
Correct answer is option 'D'. Can you explain this answer?
A fair dice is rolled twice. The probability that an odd number will follow an even number is
a)
1/2
b)
1/6
c)
1/3
d)
1/4

|
Raghavendra Sharma answered |
Probability of even number =3/6 =1/2
Probability of odd number =3/6 =1/2
Both are independent so probability=1/2.1/2 =1/4
An examination consists of two papers, Paper 1 and Paper 2. The probability of failing in Paper 1 is 0.3 and that in Paper 2 is 0.2. Given that a student has failed in Paper 2, the probability of failing in Paper 1 is 0.6. The probability of a student failing in both the papers is- a)0.5
- b)0.18
- c) 0.12
- d) 0.06
Correct answer is option 'C'. Can you explain this answer?
An examination consists of two papers, Paper 1 and Paper 2. The probability of failing in Paper 1 is 0.3 and that in Paper 2 is 0.2. Given that a student has failed in Paper 2, the probability of failing in Paper 1 is 0.6. The probability of a student failing in both the papers is
a)
0.5
b)
0.18
c)
0.12
d)
0.06
|
|
Akshita Choudhury answered |
Understanding the Problem
To find the probability of a student failing both papers, we will use the information given about the probabilities of failing each paper and their conditional probabilities.
Given Probabilities
- Probability of failing Paper 1 (P(F1)) = 0.3
- Probability of failing Paper 2 (P(F2)) = 0.2
- Conditional probability of failing Paper 1 given failing Paper 2 (P(F1 | F2)) = 0.6
Using the Conditional Probability Formula
To find the probability of failing both papers (P(F1 ∩ F2)), we can use the formula:
P(F1 ∩ F2) = P(F2) * P(F1 | F2)
Calculating the Probability
1. Find P(F1 ∩ F2):
- Substitute the known values into the formula:
- P(F1 ∩ F2) = P(F2) * P(F1 | F2)
- P(F1 ∩ F2) = 0.2 * 0.6
2. Calculate:
- P(F1 ∩ F2) = 0.12
Conclusion
Thus, the probability of a student failing both Paper 1 and Paper 2 is 0.12.
The correct answer is option 'C'.
A box contains 2 washers, 3 nuts and 4 bolts. Items are drawn from the box at random one at a time without replacement. The probability of drawing 2 washers first followed by 3 nuts and subsequently the 4 bolts is- a)2/315
- b)1/630
- c)1/1260
- d)1/2520
Correct answer is option 'C'. Can you explain this answer?
A box contains 2 washers, 3 nuts and 4 bolts. Items are drawn from the box at random one at a time without replacement. The probability of drawing 2 washers first followed by 3 nuts and subsequently the 4 bolts is
a)
2/315
b)
1/630
c)
1/1260
d)
1/2520
|
|
Jaideep Dasgupta answered |
Here sample space = 9
The required probability of drawing 2 washers, 3 nuts and 4 bolts respectively without replac ement

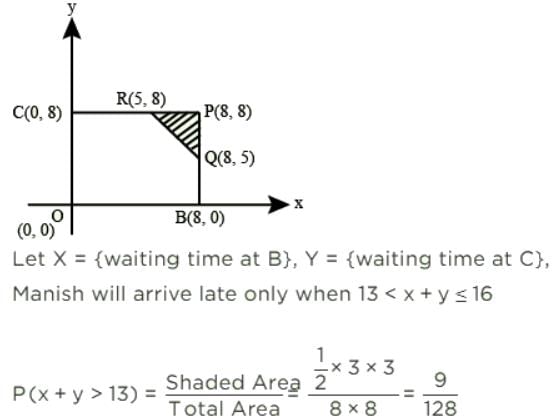
Manish has to travel from A to D changing buses at stops B and C enroute. The maximum waiting time at either stop can be 8 minutes each, but any time of waiting up to 8 minutes is equally likely at both places. He can afford up to 13 minutes of total waiting time if he is to arrive at D on time. What is the probability that Manish will arrive late at D?
- a)9/128
- b)13/64
- c)119/128
- d)8/13
Correct answer is option 'A'. Can you explain this answer?
Manish has to travel from A to D changing buses at stops B and C enroute. The maximum waiting time at either stop can be 8 minutes each, but any time of waiting up to 8 minutes is equally likely at both places. He can afford up to 13 minutes of total waiting time if he is to arrive at D on time. What is the probability that Manish will arrive late at D?
a)
9/128
b)
13/64
c)
119/128
d)
8/13

|
Machine Experts answered |
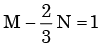
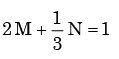
Px(x) = M exp(–2|x|) – N exp(–3 |x|) is the probability density function for the real random variable X, over the entire x axis. M and N are both positive real numbers. The equation relating M and N is - a)
- b)
- c)

- d)
Correct answer is option 'A'. Can you explain this answer?
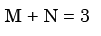
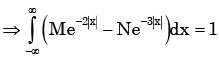
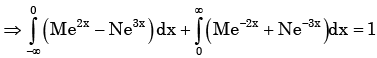
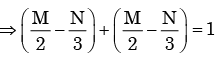
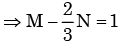
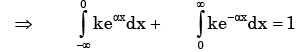
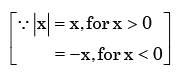
Px(x) = M exp(–2|x|) – N exp(–3 |x|) is the probability density function for the real random variable X, over the entire x axis. M and N are both positive real numbers. The equation relating M and N is
a)
b)
c)
d)

|
Pathways Academy answered |
Given Px (x ) is the probability density function for the random variable X.
Two dice are thrown simultaneously. The probability that at least one of them will have 6 facing up is - a)1/36
- b)1/3
- c)25/36
- d)11/36
Correct answer is option 'D'. Can you explain this answer?
Two dice are thrown simultaneously. The probability that at least one of them will have 6 facing up is
a)
1/36
b)
1/3
c)
25/36
d)
11/36
|
|
Ravi Singh answered |
P(atleast one of dice will have 6 facing
= 1 - P(none of dice have 6 facing up)
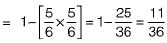
= 1 - P(none of dice have 6 facing up)
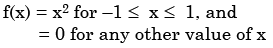
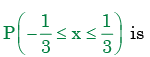
A probability density function is of the form 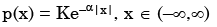 The value of K is
 - a)0.5
- b)1
- c)0.5α
- d)α
Correct answer is option 'C'. Can you explain this answer?
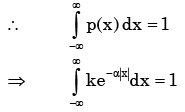
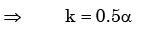
A probability density function is of the form
The value of K is
a)
0.5
b)
1
c)
0.5α
d)
α
|
|
Ravi Singh answered |
As (x) is a probability density function
A box contains 20 defective items and 80 non-defective items. If two items are selected at random without replacement, what will be the probability that both items are defective? - a)1/5
- b)1/25
- c)20/99
- d)11/495
Correct answer is option 'D'. Can you explain this answer?
A box contains 20 defective items and 80 non-defective items. If two items are selected at random without replacement, what will be the probability that both items are defective?
a)
1/5
b)
1/25
c)
20/99
d)
11/495

|
Kaavya Sengupta answered |
Total number of items = 100
Number of defective items = 20
Number of Non-defective items = 80
Then the probability that both items are defective, when 2 items are selected at random is,
⇒ P= (20C2x80C0)/(100C2) = 19/495
Can you explain the answer of this question below:Let X and Y be two independent random variables. Which one of the relations between expectation (E), variance (Var) and covariance (Cov) given below is FALSE?
- A:
E (XY) = E (X) E (Y)
- B:
Cov (X, Y) = 0
- C:
Var (X + Y) = Var (X) + Var (Y)
- D:
E (X2 y2) = (E (X))2 (E (y))2
The answer is b.
Let X and Y be two independent random variables. Which one of the relations between expectation (E), variance (Var) and covariance (Cov) given below is FALSE?
E (XY) = E (X) E (Y)
Cov (X, Y) = 0
Var (X + Y) = Var (X) + Var (Y)
E (X2 y2) = (E (X))2 (E (y))2

|
Anirudh Kulkarni answered |
Chebyshev is a mathematical term that refers to the Chebyshev inequality or the Chebyshev's theorem. It is a statistical concept that provides an upper bound for the probability of a random variable deviating from its mean by more than a certain number of standard deviations.
The Chebyshev's inequality states that for any random variable with a finite mean and variance, the probability that the random variable deviates from its mean by more than k standard deviations is less than or equal to 1/k^2, where k is any positive number greater than 1.
In other words, Chebyshev's inequality provides a general bound on the probability of extreme events occurring, regardless of the shape of the probability distribution. It is widely used in probability theory and statistics to estimate the likelihood of rare events or outliers.
The Chebyshev inequality is a useful tool in statistical analysis and can be applied to various fields including finance, physics, and engineering. It allows for the estimation of probabilities without assuming any specific distribution, which makes it a versatile and practical tool in many applications.
Can you explain the answer of this question below:Three companies X, Y and Z supply computers to a university. The percentage of computers supplied by them and the probability of those being defective are tabulated below
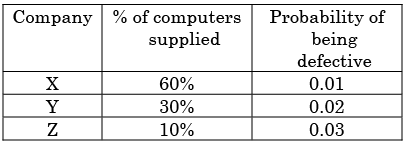
Given that a computer is defective, the probability that it was supplied by Y is
- A:
0. 1
- B:
0.2
- C:
0.3
- D:
0.4
The answer is d.
Three companies X, Y and Z supply computers to a university. The percentage of computers supplied by them and the probability of those being defective are tabulated below
Given that a computer is defective, the probability that it was supplied by Y is
0. 1
0.2
0.3
0.4
|
|
Kabir Verma answered |
Probability of defective computer supplied by Y =
(Case when Y produces defective)/(All cases of producing defective product)
Case when Y produces defective = (0.3)(0.02) = 0.006
All cases of producing defective product= (0.6x0.01)+(0.3x0.02)
(0.1x0.03)= 0.006+0.006+0.003=0.015
(Case when Y produces defective)/(All cases of producing defective product)
Case when Y produces defective = (0.3)(0.02) = 0.006
All cases of producing defective product= (0.6x0.01)+(0.3x0.02)
(0.1x0.03)= 0.006+0.006+0.003=0.015
Probability = 0.006/0.015=0.4
Let P(E) denote the probability of the even E. Given 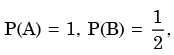 the values of
 respectively are
 - a)

- b)

- c)

- d)

Correct answer is option 'D'. Can you explain this answer?
Let P(E) denote the probability of the even E. Given the values of respectively are
the values of respectively are a)
b)
c)
d)

|
Bhaskar Unni answered |
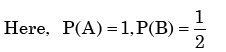
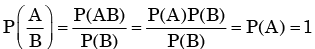
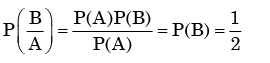
We need to find the conditional probability of two given events without being told about P(AB). Also it is not mentioned that they are independent events. But since P(A)=1, it means that A covers the complete sample.
So, P(AB)=P(B)=1/2

In Regression Analysis, if a quantitative variable has 'm' categories, one can introduce- a)Only m + 1 dummy variables
- b)Only m -1 dummy variables
- c)Only m dummy variables
- d)Only 2 m variables
Correct answer is option 'B'. Can you explain this answer?
In Regression Analysis, if a quantitative variable has 'm' categories, one can introduce
a)
Only m + 1 dummy variables
b)
Only m -1 dummy variables
c)
Only m dummy variables
d)
Only 2 m variables

|
Nabanita Saha answered |
Introduction:
Regression analysis is a statistical technique used to model the relationship between a dependent variable and one or more independent variables. In regression analysis, when we have a quantitative variable with m categories, we need to introduce dummy variables to represent these categories in the regression model.
Explanation:
To introduce dummy variables for a quantitative variable with m categories, we need to follow certain rules:
1. Number of Dummy Variables:
We need to introduce m - 1 dummy variables for a quantitative variable with m categories. The reason behind this is the concept of "dummy variable trap" or "multicollinearity".
2. Dummy Variable Trap:
The dummy variable trap occurs when we include a dummy variable for each category of a qualitative variable in the regression model. Including a dummy variable for each category can lead to perfect multicollinearity, where the independent variables are highly correlated. This can result in an unstable regression model with unreliable coefficient estimates.
3. Multicollinearity:
Multicollinearity refers to the situation where two or more independent variables in a regression model are highly correlated with each other. In the case of introducing a dummy variable for each category, one category becomes the reference or baseline category, and the remaining m - 1 categories are represented by dummy variables. As a result, the dummy variables are perfectly correlated with each other, leading to multicollinearity.
4. Baseline Category:
By introducing m - 1 dummy variables, we implicitly define one category as the baseline or reference category. The baseline category is the category for which the coefficients of dummy variables are compared and interpreted. The coefficients of the dummy variables represent the difference in the mean value of the dependent variable between each category and the baseline category.
Conclusion:
In regression analysis, when a quantitative variable has m categories, we introduce m - 1 dummy variables to avoid the dummy variable trap and multicollinearity. By doing so, we can accurately model the relationship between the dependent variable and the quantitative variable with multiple categories.
If a constant 60 is subtracted from each of the values of X and Y, then the regression coefficient is- a)reduced by 60
- b)increased by 60
- c)1/60th of the original regression coefficient
- d)not changed
Correct answer is option 'D'. Can you explain this answer?
If a constant 60 is subtracted from each of the values of X and Y, then the regression coefficient is
a)
reduced by 60
b)
increased by 60
c)
1/60th of the original regression coefficient
d)
not changed

|
Crack Gate answered |
The regression coefficient are independent of the change of the origin. But , they are not independent of the change of the scale. It means there will be no effect on the regression coefficient if any constant is subtracted from the values of x and y
∴ After subtracting constant 60 from each value of X and Y, the regression coefficient is not changed.
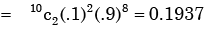
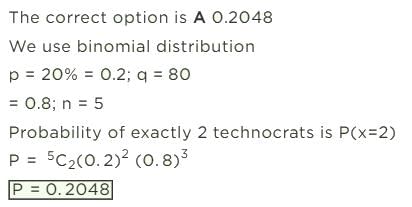
A lot has 10% defective items. Ten items are chosen randomly from this lot. The probability that exactly 2 of the chosen items are defective is - a)0.0036
- b)0.1937
- c)0.2234
- d)0.3874
Correct answer is option 'B'. Can you explain this answer?
A lot has 10% defective items. Ten items are chosen randomly from this lot. The probability that exactly 2 of the chosen items are defective is
a)
0.0036
b)
0.1937
c)
0.2234
d)
0.3874
|
|
Anirudh Banerjee answered |
Let A be the event that items are defective and B be the event that items are non- defective
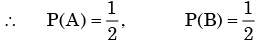
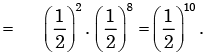
∴ P( A )= 0.1 and P(B) = 0.9
∴ Probability that exactly two of those items are defective
If the regression line of Y on X is Y = 30 - 0.9X and the standard deviations are Sx = 2 and Sy = 9, then the value of the correlation coefficient rxy is:- a)-0.3
- b)-0.2
- c)0.2
- d)0.3
Correct answer is option 'B'. Can you explain this answer?
If the regression line of Y on X is Y = 30 - 0.9X and the standard deviations are Sx = 2 and Sy = 9, then the value of the correlation coefficient rxy is:
a)
-0.3
b)
-0.2
c)
0.2
d)
0.3

|
Srestha Khanna answered |
Calculation of Correlation Coefficient
Given:
- Regression line of Y on X: Y = 30 - 0.9X
- Standard deviation of X (Sx): 2
- Standard deviation of Y (Sy): 9
Formula:
rxy = -√(1 - (b^2)(Sy^2)/(Sx^2)(Sy^2))
Calculation:
- Slope (b) of the regression line = -0.9
- Substitute the values into the formula:
rxy = -√(1 - (-0.9)^2(9^2)/(2^2)(9^2))
rxy = -√(1 - 0.81*81/4*81)
rxy = -√(1 - 0.65625)
rxy = -√0.34375
rxy ≈ -0.586
Result: The value of the correlation coefficient rxy is approximately -0.586, which is closest to option B (-0.2).
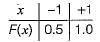
Consider a random variable Xthat takes values +1 and -1 with probability 0.5 each. The values of the cumulative distribution function F(x) at x = -1 and +1 are- a)0 and 0.5
- b)0 and 1
- c)0.5 and 1
- d)0.25 and 0.75
Correct answer is option 'C'. Can you explain this answer?
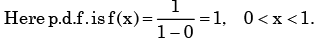
Consider a random variable Xthat takes values +1 and -1 with probability 0.5 each. The values of the cumulative distribution function F(x) at x = -1 and +1 are
a)
0 and 0.5
b)
0 and 1
c)
0.5 and 1
d)
0.25 and 0.75
|
|
Madhurima Kumar answered |
The p.d.t of the random variable is

The cumulative distribution function F(x) is the probability uptox as given below:
The cumulative distribution function F(x) is the probability uptox as given below:
Seven (distinct) car accidents occurred in a week. What is the probability that they all occurred on the same day?- a)1/77
- b)1/76
- c)1/27
- d)7/27
Correct answer is option 'B'. Can you explain this answer?
Seven (distinct) car accidents occurred in a week. What is the probability that they all occurred on the same day?
a)
1/77
b)
1/76
c)
1/27
d)
7/27
|
|
Rohan Kumar answered |
Sample space = 77
All accidents on the same day = 7 ways (all on Monday, all on Tuesday...)
So, required probability
All accidents on the same day = 7 ways (all on Monday, all on Tuesday...)
So, required probability
There are 25 calculators in a box. Two of them are defective. Suppose 5 calculators are randomly picked for inspection (i.e., each has the same chance of being selected), what is the probability that only one of the defective calculators will be included in the inspection?- a)1/2
- b)1/3
- c)1/4
- d)1/5
Correct answer is option 'B'. Can you explain this answer?
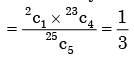
There are 25 calculators in a box. Two of them are defective. Suppose 5 calculators are randomly picked for inspection (i.e., each has the same chance of being selected), what is the probability that only one of the defective calculators will be included in the inspection?
a)
1/2
b)
1/3
c)
1/4
d)
1/5
|
|
Keerthana Joshi answered |
Probability of only one is defective out of 5 calculators
Dimension reduction methods have the goal of using the correlation structure among the predictor variables to accomplish which of the following:A. To reduce the number of predictor componentsB. To help ensure that these components are dependentC. To provide a framework for interpretability of the resultsD. To help ensure that these components are independentE. To increase the number of predictor componentsChoose the correct answer from the options given below: - a)A, B, D and E only
- b)A, C and D only
- c)A, B, C and E only
- d)B, C, D and E only
Correct answer is option 'B'. Can you explain this answer?
Dimension reduction methods have the goal of using the correlation structure among the predictor variables to accomplish which of the following:
A. To reduce the number of predictor components
B. To help ensure that these components are dependent
C. To provide a framework for interpretability of the results
D. To help ensure that these components are independent
E. To increase the number of predictor components
Choose the correct answer from the options given below:
a)
A, B, D and E only
b)
A, C and D only
c)
A, B, C and E only
d)
B, C, D and E only
|
|
Aarav Kulkarni answered |
Dimension Reduction Methods in Predictor Variables:
Goal:
- The goal of dimension reduction methods is to use the correlation structure among the predictor variables to achieve certain objectives.
Objective:
- The main objective is to reduce the number of predictor components while maintaining the essential information contained in the original dataset.
Benefits:
- By reducing the dimensionality of the data, it becomes easier to analyze and interpret the results.
- It can help in identifying the most significant predictors and removing redundant variables.
- Dimension reduction can also lead to improved model performance by reducing overfitting.
Accomplishments:
- Dimension reduction methods aim to ensure that the components derived are dependent on the correlation structure of the data.
- It helps to maintain the interrelationships between the predictors while reducing the overall dimensionality.
Therefore, the correct answer to the question is option 'B' - Dimension reduction methods aim to reduce the number of predictor components while ensuring that these components are dependent on the correlation structure of the data.
If the difference between the expectation of the square of a random variable (E[x2] and the square of the expectation of the random variable (E[x])2 is denoted by R, then
- a)R = 0
- b)R < 0
- c)R ≥ 0
- d)R > 0
Correct answer is option 'C'. Can you explain this answer?
If the difference between the expectation of the square of a random variable (E[x2] and the square of the expectation of the random variable (E[x])2 is denoted by R, then
a)
R = 0
b)
R < 0
c)
R ≥ 0
d)
R > 0
|
|
Srishti Yadav answered |
Random variable assigns a real number to each possible outcome.
Let X be a discreet random variable,then
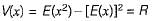
where V(x) is the variance of x,
Explanation:
- The difference between the expectation of the square of a random variable (E[X2]) and the square of the expectation of the random variable (E[X])2 is called the variance of a random variable
- Variance measure how far a set of numbers is spread out
- A variance of zero(R=0) indicates that all the values are identical
- A variance of X = R =E[X2]- (E[X])2 This quantity is always non-negative as it is an expectation of a non-negative quantity
- A non-zero variance is always positive means R > 0
So, R ≥ 0 is the answer. Since variance is  and hence never negative,
and hence never negative, 
From a pack of regular from a playing cards, two cards are drawn at random. What is the probability that both cards will be Kings, if first card in NOT replaced - a)1/26
- b)1/52
- c)1/169
- d)1/221
Correct answer is option 'D'. Can you explain this answer?
From a pack of regular from a playing cards, two cards are drawn at random. What is the probability that both cards will be Kings, if first card in NOT replaced
a)
1/26
b)
1/52
c)
1/169
d)
1/221
|
|
Pritam Das answered |
Understanding the Problem
To find the probability of drawing two Kings from a standard deck of playing cards without replacement, we first recognize that a standard deck contains 52 cards, including 4 Kings.
Calculating the Probability
1. First Card Draw
- When the first card is drawn, there are 4 Kings out of 52 total cards.
- The probability of drawing a King first:
- P(King 1) = 4/52
2. Second Card Draw
- After drawing the first King, 51 cards remain in the deck, including 3 Kings.
- The probability of drawing a second King:
- P(King 2 | King 1 drawn) = 3/51
3. Combined Probability
- To find the probability of both events happening (drawing two Kings), we multiply the probabilities of each event:
- P(Both Kings) = P(King 1) * P(King 2 | King 1 drawn)
- P(Both Kings) = (4/52) * (3/51)
Calculating the Final Probability
- P(Both Kings) = (4/52) * (3/51)
- Simplifying:
- = (4 * 3) / (52 * 51)
- = 12 / 2652
- = 1 / 221
Conclusion
The probability that both cards drawn are Kings, given that the first card is not replaced, is indeed 1/221. Hence, the correct answer is option D.
Analysis of variance is concerned with: - a)Determining change in a dependent variable per unit change in an independent variable
- b)Determining whether a qualitative factor affects the mean of an output variable
- c)Determining whether significant correlation exists between an output variable and an input variable.
- d)Determining whether variance in two or more populations are significantly different.
Correct answer is option 'D'. Can you explain this answer?
Analysis of variance is concerned with:
a)
Determining change in a dependent variable per unit change in an independent variable
b)
Determining whether a qualitative factor affects the mean of an output variable
c)
Determining whether significant correlation exists between an output variable and an input variable.
d)
Determining whether variance in two or more populations are significantly different.
|
|
Debolina Menon answered |
Analysis of variance is used in comparing two or more populations, e.g. Different types of manures for yelding a single crop.
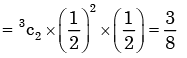
A fair coin is tossed independently four times. The probability of the event “the number of time heads shown up is more than the number of times tails shown up” is - a)1/16
- b)1/8
- c)1/4
- d)5/16
Correct answer is option 'D'. Can you explain this answer?
A fair coin is tossed independently four times. The probability of the event “the number of time heads shown up is more than the number of times tails shown up” is
a)
1/16
b)
1/8
c)
1/4
d)
5/16
|
|
Niharika Iyer answered |
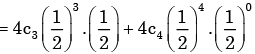
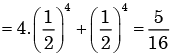
Here we have to find
P(H, H, H, T) + P(H, H, H, H)
A box contains 10 screws, 3 of which are defective. Two screws are drawn at random with replacement. The probability that none of the two screws is defective will be - a)100%
- b)50%
- c)47%
- d)49%
Correct answer is option 'D'. Can you explain this answer?
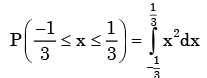
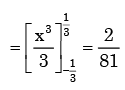
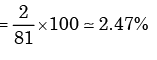
A box contains 10 screws, 3 of which are defective. Two screws are drawn at random with replacement. The probability that none of the two screws is defective will be
a)
100%
b)
50%
c)
47%
d)
49%
|
|
Aditi Sarkar answered |
To solve this problem, we can use the concept of probability. The probability of an event occurring is defined as the number of favorable outcomes divided by the total number of possible outcomes.
The total number of screws in the box is 10, and we are drawing 2 screws at random with replacement. This means that after each screw is drawn, it is placed back in the box before the second screw is drawn.
Calculating the Probability:
1. The probability of selecting a non-defective screw on the first draw is (7 non-defective screws) / (10 total screws) = 7/10.
2. Since we are drawing with replacement, the probability of selecting a non-defective screw on the second draw is also 7/10.
Since we are interested in the probability that none of the two screws is defective, we multiply the probabilities of the individual events:
P(both screws are non-defective) = P(first screw is non-defective) * P(second screw is non-defective)
= (7/10) * (7/10)
= 49/100
= 0.49 or 49%
Therefore, the probability that none of the two screws drawn is defective is 49%.
The correlation coefficient between two variables X and Y is 0.4. The correlation coefficient between 2X and (-Y) will be:- a)0.4
- b)-0.8
- c)-0.4
- d)0.8
Correct answer is option 'C'. Can you explain this answer?
The correlation coefficient between two variables X and Y is 0.4. The correlation coefficient between 2X and (-Y) will be:
a)
0.4
b)
-0.8
c)
-0.4
d)
0.8
|
|
Crack Gate answered |
Given
The correlation coefficient between two variables X and Y = 0.4
Concept used
The correlation coefficient (r) is independent of origin and scale and depend on the sign of variables
Calculation
The correlation coefficient between the two variables is the measure of the slope between the variables in the regression graph. It is given that the correlation coefficient between X and Y is 0.4 and the correlation coefficient is independent of change of origin and scale but it depends on variables
∴ The correlation coefficient between 2X and (-Y) is - 0.4
Important Points:
The value of simple correlation coefficient in the interval of [-1, 1]
The regression coefficient is independent of the change of origin. But, they are not independent of the change of the scale. It means there will be no effect on the regression coefficient if any constant is subtracted from the values of x and y
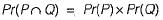
If P and Q are two random events, then the following is TRUE- a)Independence of P and Q implies that probability (P ∩ Q) - 0
- b)Probability (P ∪ Q) ≥ Probability (P) + Probability (Q)
- c)If P and Q are mutually exclusive, then they must be independent
- d)Probability ( P ∩ Q) ≤ Probability (P)
Correct answer is option 'D'. Can you explain this answer?
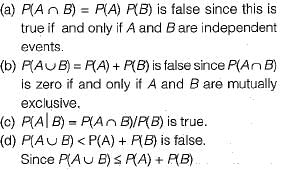
If P and Q are two random events, then the following is TRUE
a)
Independence of P and Q implies that probability (P ∩ Q) - 0
b)
Probability (P ∪ Q) ≥ Probability (P) + Probability (Q)
c)
If P and Q are mutually exclusive, then they must be independent
d)
Probability ( P ∩ Q) ≤ Probability (P)
|
|
Saranya Banerjee answered |
(a) is false since of Pand Q are independent
which need not be zero.
(b) is false since
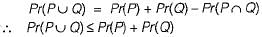
(c) is false since independence and mutually exclusion are unrelated properties.
(d) is true
which need not be zero.
(b) is false since
(c) is false since independence and mutually exclusion are unrelated properties.
(d) is true
An experiment consists of tossing a coin 20 times. Such an experiment is performed 50 times. The number of heads and the number of tails in each experiment are noted. What is the correlation coefficient between the two?- a)-1
- b)-20/50
- c)20/50
- d)1
Correct answer is option 'A'. Can you explain this answer?
An experiment consists of tossing a coin 20 times. Such an experiment is performed 50 times. The number of heads and the number of tails in each experiment are noted. What is the correlation coefficient between the two?
a)
-1
b)
-20/50
c)
20/50
d)
1

|
Swati Patel answered |
Correlation Coefficient between number of heads and tails in the experiment
To find the correlation coefficient between the number of heads and the number of tails in the experiment, we need to calculate the covariance and the standard deviations of the two variables.
Step 1: Calculate the mean
First, we need to calculate the mean of the number of heads and the number of tails.
Let's say the mean number of heads is denoted by μh and the mean number of tails is denoted by μt.
Step 2: Calculate the covariance
Next, we calculate the covariance between the number of heads and the number of tails using the formula:
Covariance (X, Y) = Σ((X - μx)(Y - μy))/(n-1)
Where X and Y are the variables (number of heads and number of tails), μx and μy are the means of the variables, and n is the number of observations.
Step 3: Calculate the standard deviations
We also need to calculate the standard deviations of the number of heads and the number of tails using the formula:
Standard Deviation (X) = √(Σ(X - μx)²/(n-1))
Where X is the variable (number of heads or number of tails), μx is the mean of the variable, and n is the number of observations.
Step 4: Calculate the correlation coefficient
Finally, we can calculate the correlation coefficient using the formula:
Correlation Coefficient = Covariance (X, Y) / (Standard Deviation (X) * Standard Deviation (Y))
Applying the steps to the given data
In this case, we have performed the experiment 50 times, each with 20 tosses of a coin. So, the number of observations (n) is 50.
Let's assume that in a single experiment, the average number of heads is 10 (μh = 10) and the average number of tails is also 10 (μt = 10).
Now, we can apply the formulas to calculate the covariance, standard deviations, and the correlation coefficient.
After the calculations, we find that the covariance is negative, i.e., Covariance (X, Y) = -20.
The standard deviation of the number of heads is 2.82, and the standard deviation of the number of tails is also 2.82.
Finally, we can calculate the correlation coefficient:
Correlation Coefficient = -20 / (2.82 * 2.82) = -20/7.9644
Simplifying further, we get the correlation coefficient as approximately -2.51.
Therefore, the correct answer is option A) -1.
Two dices are rolled simultaneously. The probability that the sum of digits on the top surface of the two dices is even, is - a)0.5
- b)0.25
- c)0.167
- d)0.125
Correct answer is option 'A'. Can you explain this answer?
Two dices are rolled simultaneously. The probability that the sum of digits on the top surface of the two dices is even, is
a)
0.5
b)
0.25
c)
0.167
d)
0.125

|
Prashanth Rane answered |
To solve this problem, we need to determine the total number of outcomes where the sum of the digits on the top surface of the two dice is even, and then divide it by the total number of possible outcomes.
Let's consider the possible outcomes for each dice individually. Each dice has six sides, numbered from 1 to 6.
- Possible outcomes for the first dice: {1, 2, 3, 4, 5, 6}
- Possible outcomes for the second dice: {1, 2, 3, 4, 5, 6}
To find the total number of outcomes, we need to consider all possible combinations of the outcomes from both dice. Since there are 6 possible outcomes for each dice, the total number of outcomes is 6 x 6 = 36.
Now, let's determine the outcomes where the sum of the digits is even. There are three possible scenarios where the sum is even:
1. Both digits are even: There are three even digits on each dice (2, 4, and 6), so the number of outcomes where both digits are even is 3 x 3 = 9.
2. Both digits are odd: There are three odd digits on each dice (1, 3, and 5), so the number of outcomes where both digits are odd is 3 x 3 = 9.
3. One digit is even and the other is odd: There are three even digits and three odd digits on each dice, so the number of outcomes where one digit is even and the other is odd is 3 x 3 = 9.
Therefore, the total number of outcomes where the sum of the digits is even is 9 + 9 + 9 = 27.
Finally, we can calculate the probability by dividing the number of outcomes where the sum is even by the total number of possible outcomes:
Probability = Number of outcomes where sum is even / Total number of outcomes
Probability = 27 / 36
Probability = 0.75
Thus, the correct answer is option A) 0.5.
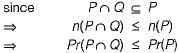
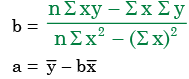
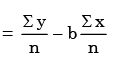
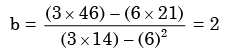
Three values of x and y are to be fitted in a straight line in the form y = a + bx by the method of least squares. GivenΣx = 6, Σy = 21, Σx2 = 14 and Σxy = 46, the values of a and b are respectively. - a)2 and 3
- b)1 and 2
- c)2 and 1
- d)3 and 2
Correct answer is option 'D'. Can you explain this answer?
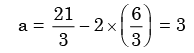
Three values of x and y are to be fitted in a straight line in the form y = a + bx by the method of least squares. GivenΣx = 6, Σy = 21, Σx2 = 14 and Σxy = 46, the values of a and b are respectively.
a)
2 and 3
b)
1 and 2
c)
2 and 1
d)
3 and 2

|
Ritika Menon answered |

If three coins are tossed simultaneously, the probability of getting at least one head is - a)1/8
- b)3/8
- c)1/2
- d)7/8
Correct answer is option 'D'. Can you explain this answer?
If three coins are tossed simultaneously, the probability of getting at least one head is
a)
1/8
b)
3/8
c)
1/2
d)
7/8
|
|
Pallabi Kulkarni answered |
Understanding the Problem
When tossing three coins, we want to find the probability of getting at least one head.
Sample Space
The sample space (all possible outcomes) when tossing three coins is:
- HHH
- HHT
- HTH
- HTT
- THH
- THT
- TTH
- TTT
This gives us a total of 2^3 = 8 outcomes.
Calculating Desired Outcomes
To find the probability of getting at least one head, it's often easier to calculate the probability of the complementary event — getting no heads (i.e., all tails).
- The only outcome for no heads is: TTT
Thus, there is 1 outcome where we get no heads.
Probability of No Heads
The probability of getting no heads (all tails) is:
- P(no heads) = Number of favorable outcomes for no heads / Total outcomes = 1/8
Calculating Probability of At Least One Head
Now, we can find the probability of getting at least one head:
- P(at least one head) = 1 - P(no heads) = 1 - 1/8 = 7/8
Final Answer
Thus, the probability of getting at least one head when tossing three coins is:
- 7/8
Therefore, the correct answer is option 'D'.
Four arbitrary point (x1,y1), (x2,y2), (x3,y3), (x4,y4), are given in the x, y – plane Using the method of least squares, if, regressing y upon x gives the fitted line y = ax + b; and regressing y upon x given the fitted line y = ax + b; and regressing x upon y gives the fitted line x = cy + d then - a)The two fitted lines must coincide
- b)The two fitted lines need not coincide
- c)It is possible that ac = 0
- d)A must be 1/c
Correct answer is option 'D'. Can you explain this answer?
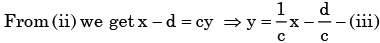
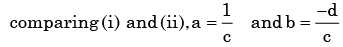
Four arbitrary point (x1,y1), (x2,y2), (x3,y3), (x4,y4), are given in the x, y – plane Using the method of least squares, if, regressing y upon x gives the fitted line y = ax + b; and regressing y upon x given the fitted line y = ax + b; and regressing x upon y gives the fitted line x = cy + d then
a)
The two fitted lines must coincide
b)
The two fitted lines need not coincide
c)
It is possible that ac = 0
d)
A must be 1/c

|
Bijoy Chauhan answered |
y =ax+b − (i) and x = cy + d − (ii)
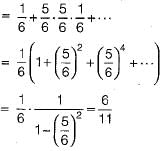
Two players, A and B, alternately keep rolling a fair dice. The person to get a six first wins the game. Given that player A starts the game, the probability that A wins the game is - a)5/11
- b)1/2
- c)7/13
- d)6/11
Correct answer is option 'D'. Can you explain this answer?
Two players, A and B, alternately keep rolling a fair dice. The person to get a six first wins the game. Given that player A starts the game, the probability that A wins the game is
a)
5/11
b)
1/2
c)
7/13
d)
6/11
|
|
Diya Kumar answered |
P(A wins) = p(6 in first throw by A) + p(A not 6, B not 6, A 6) + ...
A fair coin is tossed till a head appears for the first time. The probability that the number of required tosses is odd, is- a)1/3
- b)1/2
- c)2/3
- d)3/4
Correct answer is option 'C'. Can you explain this answer?
A fair coin is tossed till a head appears for the first time. The probability that the number of required tosses is odd, is
a)
1/3
b)
1/2
c)
2/3
d)
3/4
|
|
Muskaan Basu answered |
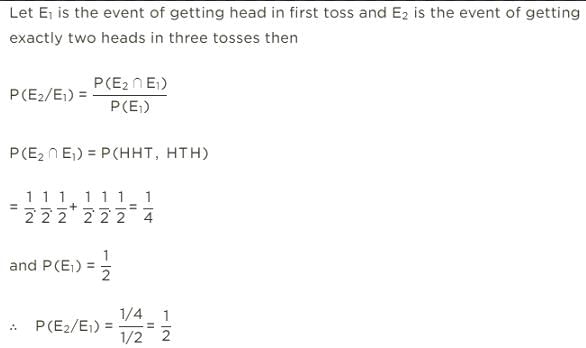
P(number of tosses is odd) = P(number of tosses is 1, 3, 5, 7 ...)
P(number of toss is 1) = P(Head in first toss = 1/2
P(number of toss is 3) = P(tail in first toss, tail in second toss and head in third toss)
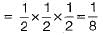
P(number of toss is 5) = P(T, T, T, T, H)
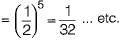
So P(number of tosses is odd)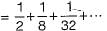
Sum of infinite geometric series with
P(number of toss is 1) = P(Head in first toss = 1/2
P(number of toss is 3) = P(tail in first toss, tail in second toss and head in third toss)
P(number of toss is 5) = P(T, T, T, T, H)
So P(number of tosses is odd)
Sum of infinite geometric series with
An examination paper has 150 multiple-choice questions of one mark each, with each question having four choices. Each incorrect answer fetches – 0.25 mark. Suppose 1000 students choose all their answers randomly with uniform probability. The sum total of the expected marks obtained all these students is - a)0
- b)2550
- c)7525
- d)9375
Correct answer is option 'D'. Can you explain this answer?
An examination paper has 150 multiple-choice questions of one mark each, with each question having four choices. Each incorrect answer fetches – 0.25 mark. Suppose 1000 students choose all their answers randomly with uniform probability. The sum total of the expected marks obtained all these students is
a)
0
b)
2550
c)
7525
d)
9375
|
|
Nandini Basak answered |
Ans.
Method to Solve :
Probability of choosing the correct option = 1/4
Probability of choosing a wrong option = 3/4
So, expected mark for a question for a student = 1/4�1+3/4�(−0.25)=1/16
Expected mark for a student for 150questions =1/16�150=9.375
So, sum total of the expected marks obtained by all 1000students = 9.375�1000=9375
Probability of choosing a wrong option = 3/4
So, expected mark for a question for a student = 1/4�1+3/4�(−0.25)=1/16
Expected mark for a student for 150questions =1/16�150=9.375
So, sum total of the expected marks obtained by all 1000students = 9.375�1000=9375
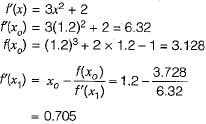
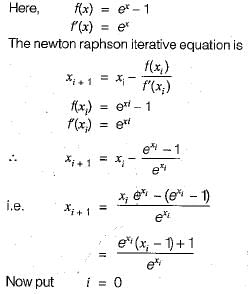
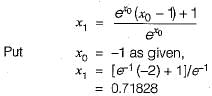
Equation ex - 1 = 0 is required to be solved using Newton's method with an initial guess x0 = -1. Then, after one step of Newton’s method, estimate x1 of the solution will be given by- a)0.71828
- b)0.36784
- c)0.20587
- d)0.00000
Correct answer is option 'A'. Can you explain this answer?
Equation ex - 1 = 0 is required to be solved using Newton's method with an initial guess x0 = -1. Then, after one step of Newton’s method, estimate x1 of the solution will be given by
a)
0.71828
b)
0.36784
c)
0.20587
d)
0.00000
|
|
Sharmila Dasgupta answered |
If the two regression lines are as under :Y = a + bXX = c + dYWhat is the correlation coefficient between variables X and Y?- a)√bc
- b)√ac
- c)√ad
- d)√bd
Correct answer is option 'D'. Can you explain this answer?
If the two regression lines are as under :
Y = a + bX
X = c + dY
What is the correlation coefficient between variables X and Y?
a)
√bc
b)
√ac
c)
√ad
d)
√bd
|
|
Snehal Tiwari answered |
The correlation coefficient between variables X and Y can be calculated using the formula:
r = √(bd)
Since the regression lines are given as:
Y = a + bX
X = c + dY
We can rearrange the second equation to solve for Y:
Y = (X - c)/d
Substituting this value of Y in the first equation, we get:
Y = a + b((X - c)/d)
This can be simplified as:
Y = (ad + bc - bd)/d
Now, we can equate this expression to the original equation for Y:
(ad + bc - bd)/d = a + bX
Rearranging the equation, we get:
ad + bc - bd = ad + bd + b^2X
Simplifying further, we have:
bc = b^2X
Dividing both sides by b, we get:
c = bX
Now, substituting this value of c in the equation X = c + dY, we get:
X = bX + dY
Rearranging the equation, we have:
Y = (X - bX)/d
Simplifying further, we get:
Y = (1 - b)/d
Now, we can substitute these values of X and Y in the correlation coefficient formula:
r = √(bd)
Substituting the values of b and d, we get:
r = √(b(1 - b))
Therefore, the correlation coefficient between variables X and Y is √(b(1 - b)).
r = √(bd)
Since the regression lines are given as:
Y = a + bX
X = c + dY
We can rearrange the second equation to solve for Y:
Y = (X - c)/d
Substituting this value of Y in the first equation, we get:
Y = a + b((X - c)/d)
This can be simplified as:
Y = (ad + bc - bd)/d
Now, we can equate this expression to the original equation for Y:
(ad + bc - bd)/d = a + bX
Rearranging the equation, we get:
ad + bc - bd = ad + bd + b^2X
Simplifying further, we have:
bc = b^2X
Dividing both sides by b, we get:
c = bX
Now, substituting this value of c in the equation X = c + dY, we get:
X = bX + dY
Rearranging the equation, we have:
Y = (X - bX)/d
Simplifying further, we get:
Y = (1 - b)/d
Now, we can substitute these values of X and Y in the correlation coefficient formula:
r = √(bd)
Substituting the values of b and d, we get:
r = √(b(1 - b))
Therefore, the correlation coefficient between variables X and Y is √(b(1 - b)).
The probability that there are 53 Sundays in a randomly chosen leap year is - a)1/7
- b)1/14
- c)1/28
- d)2/7
Correct answer is option 'D'. Can you explain this answer?
The probability that there are 53 Sundays in a randomly chosen leap year is
a)
1/7
b)
1/14
c)
1/28
d)
2/7
|
|
Sinjini Nambiar answered |
No. of days in a leap year are 366 days. In which there are 52 complete weeks and 2 days extra.
This 2 days may be of following combination.
1. Sunday & Monday
2. Monday & Tuesday
3. Tuesday & Wednesday
4. Wednesday & Thursday
5. Thursday & Friday
6. Friday & Saturday
7. Saturday & Sunday
There are two combination of Sunday in (1.) and (7).
∴ Re quired probability
=2/7
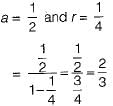
A bag contains 10 blue marbles, 20 green marbles and 30 red marbles. A marble is drawn from the bag, its colour recorded and it is put back in the bag. This process is repeated 3 times. The probability that no two of the marbles drawn have the same colour is- a)1/36
- b)1/6
- c)1/4
- d)1/3
Correct answer is option 'B'. Can you explain this answer?
A bag contains 10 blue marbles, 20 green marbles and 30 red marbles. A marble is drawn from the bag, its colour recorded and it is put back in the bag. This process is repeated 3 times. The probability that no two of the marbles drawn have the same colour is
a)
1/36
b)
1/6
c)
1/4
d)
1/3
|
|
Gauri Sen answered |
The given condition corresponds to sampling with replacement and with order.
No 2 marbles have the same color i.e. Drawn 3 different marble.
So total number of ways for picking 3 different marbles = 3! = 6.
Probability of getting blue, green, red in order
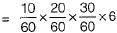
[Since 6 ways to get the marbles]
= 1/6
No 2 marbles have the same color i.e. Drawn 3 different marble.
So total number of ways for picking 3 different marbles = 3! = 6.
Probability of getting blue, green, red in order
[Since 6 ways to get the marbles]
= 1/6
The coefficient of correlation between two variables X and Y is 0.48. The covariance is 36. The variance of X is 16. The standard deviation of Y is:- a)10.15
- b)13.32
- c)16.5
- d)18.75
Correct answer is option 'D'. Can you explain this answer?
The coefficient of correlation between two variables X and Y is 0.48. The covariance is 36. The variance of X is 16. The standard deviation of Y is:
a)
10.15
b)
13.32
c)
16.5
d)
18.75

|
Engineers Adda answered |
Given
σx = √16 = 4
r = 0.48
Covariance = ∑xy/N = 36
Fomula
Covariance = ∑xy/N
r = ∑xy/N.σx × σy
Calculation
According to question
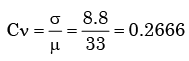
⇒ 0.48 = 36/4 × σy
⇒ σy = 9/0.48
∴ The standard deviation of y(σy) is 18.75

The probability of a defective piece being produced in a manufacturing process is 0.01. The probability that out of 5 successive pieces, only one is defective, is - a)(0. 99)2 (0.01)
- b)(0.99)( 0.01)4
- c)5× (0.99)(0.01)4
- d)5× (0.99)4(0.01)
Correct answer is option 'D'. Can you explain this answer?
The probability of a defective piece being produced in a manufacturing process is 0.01. The probability that out of 5 successive pieces, only one is defective, is
a)
(0. 99)2 (0.01)
b)
(0.99)( 0.01)4
c)
5× (0.99)(0.01)4
d)
5× (0.99)4(0.01)
|
|
Keerthana Joshi answered |
The required probability 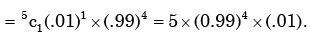

Given the regression lines X + 2Y - 5 = 0, 2X + 3Y - 8 = 0 and Var(X) = 12, the value of Var(Y) is- a)3/4
- b)4/3
- c)16
- d)4
Correct answer is option 'D'. Can you explain this answer?
Given the regression lines X + 2Y - 5 = 0, 2X + 3Y - 8 = 0 and Var(X) = 12, the value of Var(Y) is
a)
3/4
b)
4/3
c)
16
d)
4
|
|
Engineers Adda answered |
Given
Regression lines
x + 2y - 5 = 0
2x + 3y - 8 = 0
var(x)= σx = 12
Calculation
x + 2y - 5 = 0 ------(i)
Let y = - x/2 + 5/2 be the regression line of y on x [ from equation 1]
2x + 3y - 8
x = -(3/2)y + 8/2 be the regressiopn line of x on y
⇒ bxy = -1/2 and byx = -3/2
bxy = Regression line of y on x
byx = Regression line of x on y
We know that regression coefficient = r = √(byx × bxy)
⇒ r = √(-1/2 × -3/2)
∴ r = √3/2 < 1
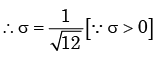
σx = 12 = 2√3
We know that byx = r (σy/σx)
⇒ -1/2 = √3/2 (σy/2√3)
⇒ σy = - 2
∴ var(y) = variance of y =(-2)2 = 4
Chapter doubts & questions for Probability and Statistics - Engineering Mathematics for Mechanical Engineering 2025 is part of Mechanical Engineering exam preparation. The chapters have been prepared according to the Mechanical Engineering exam syllabus. The Chapter doubts & questions, notes, tests & MCQs are made for Mechanical Engineering 2025 Exam. Find important definitions, questions, notes, meanings, examples, exercises, MCQs and online tests here.
Chapter doubts & questions of Probability and Statistics - Engineering Mathematics for Mechanical Engineering in English & Hindi are available as part of Mechanical Engineering exam.
Download more important topics, notes, lectures and mock test series for Mechanical Engineering Exam by signing up for free.
Engineering Mathematics for Mechanical Engineering
53 videos|124 docs|63 tests
|
|
© EduRev
|
Education Revolution
|


|


Signup to see your scores
go up within 7 days!
Access 1000+ FREE Docs, Videos and Tests
Takes less than 10 seconds to signup