


All Exams >
Computer Science Engineering (CSE) >
6 Months Preparation for GATE CSE >
All Questions
All questions of Probability and Statistics for Computer Science Engineering (CSE) Exam
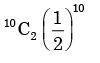
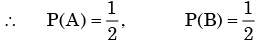
A fair coin is tossed 10 times. What is the probability that ONLY the first two tosses will yield heads? - a)

- b)

- c)

- d)
Correct answer is option 'C'. Can you explain this answer?
A fair coin is tossed 10 times. What is the probability that ONLY the first two tosses will yield heads?
a)
b)
c)
d)
|
|
Rhea Reddy answered |
Let A be the event that first toss is head
And B be the event that second toss is head.
By the given condition rest all 8 tosses should be tail
∴ The probability of getting head in first two cases

A fair dice is rolled twice. The probability that an odd number will follow an even number is - a)1/2
- b)1/6
- c)1/3
- d)1/4
Correct answer is option 'D'. Can you explain this answer?
A fair dice is rolled twice. The probability that an odd number will follow an even number is
a)
1/2
b)
1/6
c)
1/3
d)
1/4

|
Raghavendra Sharma answered |
Probability of even number =3/6 =1/2
Probability of odd number =3/6 =1/2
Both are independent so probability=1/2.1/2 =1/4
An examination consists of two papers, Paper 1 and Paper 2. The probability of failing in Paper 1 is 0.3 and that in Paper 2 is 0.2. Given that a student has failed in Paper 2, the probability of failing in Paper 1 is 0.6. The probability of a student failing in both the papers is- a)0.5
- b)0.18
- c) 0.12
- d) 0.06
Correct answer is option 'C'. Can you explain this answer?
An examination consists of two papers, Paper 1 and Paper 2. The probability of failing in Paper 1 is 0.3 and that in Paper 2 is 0.2. Given that a student has failed in Paper 2, the probability of failing in Paper 1 is 0.6. The probability of a student failing in both the papers is
a)
0.5
b)
0.18
c)
0.12
d)
0.06

|
Tanu Shindekar answered |
The probability of a student failing in both papers is 0.12
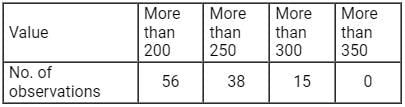
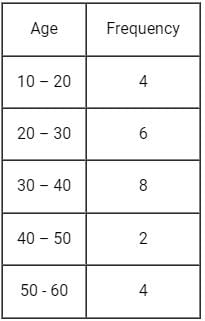
Find the no. of observations between 250 and 300 from the following data:
- a)56
- b)23
- c)15
- d)8
Correct answer is option 'B'. Can you explain this answer?
Find the no. of observations between 250 and 300 from the following data:
a)
56
b)
23
c)
15
d)
8

|
Engineers Adda answered |
Concept:
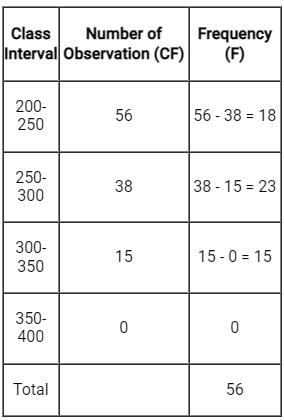
To find number of observations between 250 and 300.
first we have to draw a frequency distribution table from this data.
first we have to draw a frequency distribution table from this data.
∴ The Number of observation in between 250-300 = 38 - 15 = 23.
If the arithmetic mean of two numbers is 10 and their geometric mean is 8, the numbers are- a)12, 18
- b)16, 4
- c)15, 5
- d)20, 5
Correct answer is option 'B'. Can you explain this answer?
If the arithmetic mean of two numbers is 10 and their geometric mean is 8, the numbers are
a)
12, 18
b)
16, 4
c)
15, 5
d)
20, 5

|
Arjun Unni answered |
Let the numbers be a and b Then
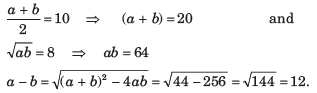
Solving a + b = 20 and a - b = 12 we get a = 16 and b = 4.
A box contains 2 washers, 3 nuts and 4 bolts. Items are drawn from the box at random one at a time without replacement. The probability of drawing 2 washers first followed by 3 nuts and subsequently the 4 bolts is- a)2/315
- b)1/630
- c)1/1260
- d)1/2520
Correct answer is option 'C'. Can you explain this answer?
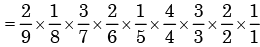
A box contains 2 washers, 3 nuts and 4 bolts. Items are drawn from the box at random one at a time without replacement. The probability of drawing 2 washers first followed by 3 nuts and subsequently the 4 bolts is
a)
2/315
b)
1/630
c)
1/1260
d)
1/2520
|
|
Jaideep Dasgupta answered |
Here sample space = 9
The required probability of drawing 2 washers, 3 nuts and 4 bolts respectively without replac ement

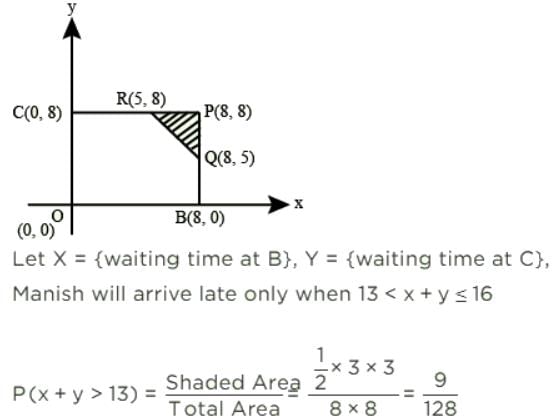
Manish has to travel from A to D changing buses at stops B and C enroute. The maximum waiting time at either stop can be 8 minutes each, but any time of waiting up to 8 minutes is equally likely at both places. He can afford up to 13 minutes of total waiting time if he is to arrive at D on time. What is the probability that Manish will arrive late at D?
- a)9/128
- b)13/64
- c)119/128
- d)8/13
Correct answer is option 'A'. Can you explain this answer?
Manish has to travel from A to D changing buses at stops B and C enroute. The maximum waiting time at either stop can be 8 minutes each, but any time of waiting up to 8 minutes is equally likely at both places. He can afford up to 13 minutes of total waiting time if he is to arrive at D on time. What is the probability that Manish will arrive late at D?
a)
9/128
b)
13/64
c)
119/128
d)
8/13

|
Machine Experts answered |
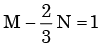
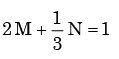
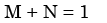
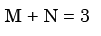
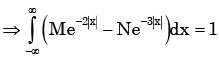
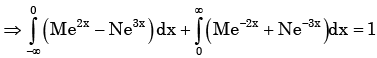
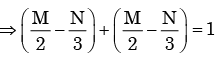
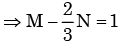
Px(x) = M exp(–2|x|) – N exp(–3 |x|) is the probability density function for the real random variable X, over the entire x axis. M and N are both positive real numbers. The equation relating M and N is - a)
- b)
- c)
- d)
Correct answer is option 'A'. Can you explain this answer?
Px(x) = M exp(–2|x|) – N exp(–3 |x|) is the probability density function for the real random variable X, over the entire x axis. M and N are both positive real numbers. The equation relating M and N is
a)
b)
c)
d)

|
Pathways Academy answered |
Given Px (x ) is the probability density function for the random variable X.
If a variable takes discrete values a + 4, a - 3.5, a - 2.5, a - 3, a - 2, a + 0.5, a + 5 and a - 0.5 where a > 0, then the median of the data set is- a)a - 2.5
- b)a - 1.25
- c)a - 1.5
- d)a - o.75
Correct answer is option 'B'. Can you explain this answer?
If a variable takes discrete values a + 4, a - 3.5, a - 2.5, a - 3, a - 2, a + 0.5, a + 5 and a - 0.5 where a > 0, then the median of the data set is
a)
a - 2.5
b)
a - 1.25
c)
a - 1.5
d)
a - o.75
|
|
Engineers Adda answered |
Given:
The given values = a + 4, a – 3.5, a – 2.5, a – 3, a – 2, a + 0.5, a + 5 and a – 0.5
The given values = a + 4, a – 3.5, a – 2.5, a – 3, a – 2, a + 0.5, a + 5 and a – 0.5
Concept used:
If n is odd
Median = [(n + 1)/2]th observations
If n is even
Median = [(n/2)th + (n/2 + 1)th observations]/2
Calculation:
a + 4, a – 3.5, a – 2.5, a – 3, a – 2, a + 0.5, a + 5 and a – 0.5
Arrange the data in ascending order
⇒ a – 3.5, a – 3, a – 2.5, a – 2, a – 0.5, a + 0.5, a + 4, a + 5
Here, the n is 8, which is even
Median = [(n/2)th + (n/2 + 1)th observations]/2
⇒ [(8/2) + (8/2 + 1)/2] term
⇒ 4th + 5th term
⇒ [(a – 2 + a – 0.5)/2]
⇒ [(2a – 2.5)/2]
⇒ a – 1.25
∴ The median of the data set is a – 1.25
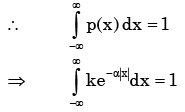
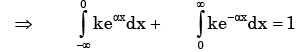
A probability density function is of the form 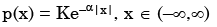 The value of K is
 - a)0.5
- b)1
- c)0.5α
- d)α
Correct answer is option 'C'. Can you explain this answer?
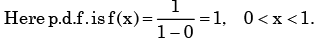
A probability density function is of the form
The value of K is
a)
0.5
b)
1
c)
0.5α
d)
α
|
|
Ravi Singh answered |
As (x) is a probability density function
Two dice are thrown simultaneously. The probability that at least one of them will have 6 facing up is - a)1/36
- b)1/3
- c)25/36
- d)11/36
Correct answer is option 'D'. Can you explain this answer?
Two dice are thrown simultaneously. The probability that at least one of them will have 6 facing up is
a)
1/36
b)
1/3
c)
25/36
d)
11/36
|
|
Ravi Singh answered |
P(atleast one of dice will have 6 facing
= 1 - P(none of dice have 6 facing up)
= 1 - P(none of dice have 6 facing up)
A box contains 20 defective items and 80 non-defective items. If two items are selected at random without replacement, what will be the probability that both items are defective? - a)1/5
- b)1/25
- c)20/99
- d)11/495
Correct answer is option 'D'. Can you explain this answer?
A box contains 20 defective items and 80 non-defective items. If two items are selected at random without replacement, what will be the probability that both items are defective?
a)
1/5
b)
1/25
c)
20/99
d)
11/495

|
Kaavya Sengupta answered |
Total number of items = 100
Number of defective items = 20
Number of Non-defective items = 80
Then the probability that both items are defective, when 2 items are selected at random is,
⇒ P= (20C2x80C0)/(100C2) = 19/495
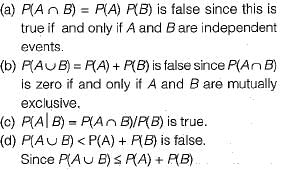
Can you explain the answer of this question below:Let X and Y be two independent random variables. Which one of the relations between expectation (E), variance (Var) and covariance (Cov) given below is FALSE?
- A:
E (XY) = E (X) E (Y)
- B:
Cov (X, Y) = 0
- C:
Var (X + Y) = Var (X) + Var (Y)
- D:
E (X2 y2) = (E (X))2 (E (y))2
The answer is b.
Let X and Y be two independent random variables. Which one of the relations between expectation (E), variance (Var) and covariance (Cov) given below is FALSE?
E (XY) = E (X) E (Y)
Cov (X, Y) = 0
Var (X + Y) = Var (X) + Var (Y)
E (X2 y2) = (E (X))2 (E (y))2

|
Anirudh Kulkarni answered |
Chebyshev is a mathematical term that refers to the Chebyshev inequality or the Chebyshev's theorem. It is a statistical concept that provides an upper bound for the probability of a random variable deviating from its mean by more than a certain number of standard deviations.
The Chebyshev's inequality states that for any random variable with a finite mean and variance, the probability that the random variable deviates from its mean by more than k standard deviations is less than or equal to 1/k^2, where k is any positive number greater than 1.
In other words, Chebyshev's inequality provides a general bound on the probability of extreme events occurring, regardless of the shape of the probability distribution. It is widely used in probability theory and statistics to estimate the likelihood of rare events or outliers.
The Chebyshev inequality is a useful tool in statistical analysis and can be applied to various fields including finance, physics, and engineering. It allows for the estimation of probabilities without assuming any specific distribution, which makes it a versatile and practical tool in many applications.
Can you explain the answer of this question below:Three companies X, Y and Z supply computers to a university. The percentage of computers supplied by them and the probability of those being defective are tabulated below
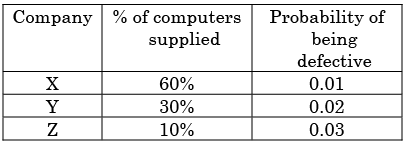
Given that a computer is defective, the probability that it was supplied by Y is
- A:
0. 1
- B:
0.2
- C:
0.3
- D:
0.4
The answer is d.
Three companies X, Y and Z supply computers to a university. The percentage of computers supplied by them and the probability of those being defective are tabulated below
Given that a computer is defective, the probability that it was supplied by Y is
0. 1
0.2
0.3
0.4
|
|
Kabir Verma answered |
Probability of defective computer supplied by Y =
(Case when Y produces defective)/(All cases of producing defective product)
Case when Y produces defective = (0.3)(0.02) = 0.006
All cases of producing defective product= (0.6x0.01)+(0.3x0.02)
(0.1x0.03)= 0.006+0.006+0.003=0.015
(Case when Y produces defective)/(All cases of producing defective product)
Case when Y produces defective = (0.3)(0.02) = 0.006
All cases of producing defective product= (0.6x0.01)+(0.3x0.02)
(0.1x0.03)= 0.006+0.006+0.003=0.015
Probability = 0.006/0.015=0.4
Find the mean of given data:
- a)39.95
- b)35.70
- c)43.95
- d)23.95
Correct answer is option 'B'. Can you explain this answer?
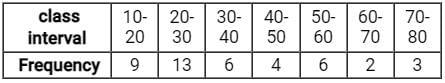
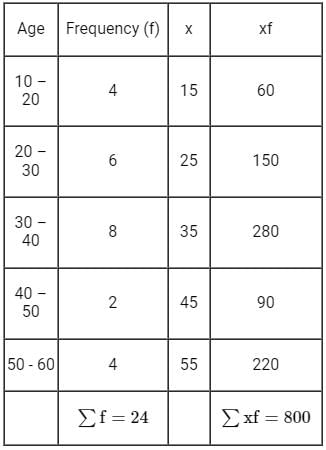
Find the mean of given data:
a)
39.95
b)
35.70
c)
43.95
d)
23.95
|
|
Engineers Adda answered |
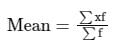
Formula used:
The mean of grouped data is given by,
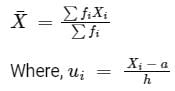
Xi = mean of ith class
fi = frequency corresponding to ith class
Given:
fi = frequency corresponding to ith class
Given:
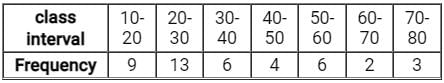
Calculation:
Now, to calculate the mean of data will have to find ∑fiXi and ∑fi as below,
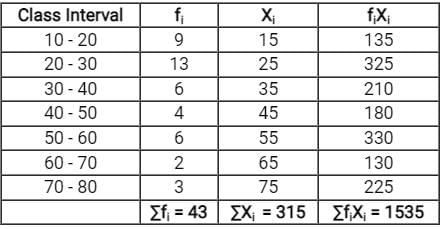
Now, to calculate the mean of data will have to find ∑fiXi and ∑fi as below,
Then,
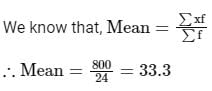
We know that, mean of grouped data is given by
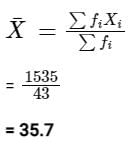
We know that, mean of grouped data is given by
Hence, the mean of the grouped data is 35.7
The mean of 25 observations is 36 . If the mean of the first 13 observations is 32 and that of the last 13 observations is 39 , the 13th observation is: - a)22
- b)25
- c)26
- d)23
Correct answer is option 'D'. Can you explain this answer?
The mean of 25 observations is 36 . If the mean of the first 13 observations is 32 and that of the last 13 observations is 39 , the 13th observation is:
a)
22
b)
25
c)
26
d)
23
|
|
Engineers Adda answered |
Given:
The mean of 25 observations is 36
The mean of the first 13 observations is 32 and that of the last 13 observations is 39
The mean of 25 observations is 36
The mean of the first 13 observations is 32 and that of the last 13 observations is 39
Concept used:
Mean = sum of all observation/total number of observation
Mean = sum of all observation/total number of observation
Calculation:
The sum of all 25 observation = 25 × 36 = 900
Sum of first 13 observations = 13 × 32 = 416
Sum of last 13 observations = 13 × 39 = 507
∴ 13th term = (416 + 507) - 900 = 923 - 900 = 23
The sum of all 25 observation = 25 × 36 = 900
Sum of first 13 observations = 13 × 32 = 416
Sum of last 13 observations = 13 × 39 = 507
∴ 13th term = (416 + 507) - 900 = 923 - 900 = 23
Let P(E) denote the probability of the even E. Given  the values of
 respectively are
 - a)

- b)

- c)

- d)

Correct answer is option 'D'. Can you explain this answer?
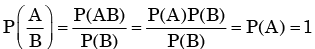
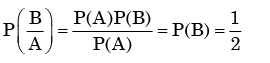
Let P(E) denote the probability of the even E. Given the values of respectively are
the values of respectively are a)
b)
c)
d)

|
Bhaskar Unni answered |
We need to find the conditional probability of two given events without being told about P(AB). Also it is not mentioned that they are independent events. But since P(A)=1, it means that A covers the complete sample.
So, P(AB)=P(B)=1/2

In Regression Analysis, if a quantitative variable has 'm' categories, one can introduce- a)Only m + 1 dummy variables
- b)Only m -1 dummy variables
- c)Only m dummy variables
- d)Only 2 m variables
Correct answer is option 'B'. Can you explain this answer?
In Regression Analysis, if a quantitative variable has 'm' categories, one can introduce
a)
Only m + 1 dummy variables
b)
Only m -1 dummy variables
c)
Only m dummy variables
d)
Only 2 m variables

|
Crack Gate answered |
- If a quantitative variable in regression analysis has "m" categories, one can add "m-1" dummy variables to the model. Dummy coding or indicator variable coding are terms used to describe this method.
- To represent categorical data in a regression model, utilize dummy coding. One category of the original variable is identified as the reference or baseline category, and one binary (dummy) variable is created for each of the other categories. Usually, the category with the lowest or most frequent value is the reference category.
Hence, In Regression Analysis, if a quantitative variable has 'm' categories, one can introduce Only m -1 dummy variables.
If a constant 60 is subtracted from each of the values of X and Y, then the regression coefficient is- a)reduced by 60
- b)increased by 60
- c)1/60th of the original regression coefficient
- d)not changed
Correct answer is option 'D'. Can you explain this answer?
If a constant 60 is subtracted from each of the values of X and Y, then the regression coefficient is
a)
reduced by 60
b)
increased by 60
c)
1/60th of the original regression coefficient
d)
not changed
|
|
Crack Gate answered |
The regression coefficient are independent of the change of the origin. But , they are not independent of the change of the scale. It means there will be no effect on the regression coefficient if any constant is subtracted from the values of x and y
∴ After subtracting constant 60 from each value of X and Y, the regression coefficient is not changed.
Given that E and F are events such that P(E) = 0.5, P(F) = 0.4 and P(E∩F) = 0.3, then what will be the value of P(F|E)?- a)2/5
- b)3/5
- c)3/4
- d)2/4
Correct answer is option 'B'. Can you explain this answer?
Given that E and F are events such that P(E) = 0.5, P(F) = 0.4 and P(E∩F) = 0.3, then what will be the value of P(F|E)?
a)
2/5
b)
3/5
c)
3/4
d)
2/4
|
|
Crack Gate answered |
We know that P(F|E) = P(E∩F) / P(E). (By formula for conditional probability)
Value of P(E∩F) is given to be 0.3 and value of P(E) is given to be 0.5.
P(F|E) = (0.3) / (0.5).
P(F|E) = 3 / 5.
Value of P(E∩F) is given to be 0.3 and value of P(E) is given to be 0.5.
P(F|E) = (0.3) / (0.5).
P(F|E) = 3 / 5.
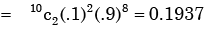
A lot has 10% defective items. Ten items are chosen randomly from this lot. The probability that exactly 2 of the chosen items are defective is - a)0.0036
- b)0.1937
- c)0.2234
- d)0.3874
Correct answer is option 'B'. Can you explain this answer?
A lot has 10% defective items. Ten items are chosen randomly from this lot. The probability that exactly 2 of the chosen items are defective is
a)
0.0036
b)
0.1937
c)
0.2234
d)
0.3874
|
|
Anirudh Banerjee answered |
Let A be the event that items are defective and B be the event that items are non- defective
∴ P( A )= 0.1 and P(B) = 0.9
∴ Probability that exactly two of those items are defective
Let x denote the number of times heads occur in n tosses of a fair coin, If P(x = 4), P(x = 5) and P(x = 6) are in AP, then the value of n is- a)7
- b)10
- c)12
- d)15
Correct answer is option 'A'. Can you explain this answer?
Let x denote the number of times heads occur in n tosses of a fair coin, If P(x = 4), P(x = 5) and P(x = 6) are in AP, then the value of n is
a)
7
b)
10
c)
12
d)
15
|
|
Bhaskar Mukherjee answered |
Problem Analysis:
We are given that x denotes the number of times heads occur in n tosses of a fair coin. We need to find the value of n when the probabilities P(x=4), P(x=5), and P(x=6) are in arithmetic progression (AP).
Solution:
Step 1: Understanding the Arithmetic Progression (AP)
An arithmetic progression is a sequence of numbers in which the difference between any two consecutive terms is constant. In other words, the terms of an arithmetic progression form a sequence in which the difference between consecutive terms is always the same.
Step 2: Understanding the Probability Distribution
In this problem, x represents the number of times heads occur in n tosses of a fair coin. Since it is a fair coin, the probability of getting a head on each toss is 0.5, and the probability of getting a tail is also 0.5. Therefore, the probability distribution of x follows a binomial distribution.
Step 3: Finding the Probabilities
To find the probabilities P(x=4), P(x=5), and P(x=6), we need to use the binomial probability formula:
P(x) = (nC x) * (p^x) * (q^(n-x))
Where nC x represents n choose x (the number of ways to choose x items from a set of n items), p represents the probability of getting a head on a single toss, q represents the probability of getting a tail on a single toss, and x represents the number of times heads occur.
Since it is a fair coin, p = q = 0.5.
Using the formula, we can calculate the probabilities as follows:
P(x=4) = (nC4) * (0.5^4) * (0.5^(n-4))
P(x=5) = (nC5) * (0.5^5) * (0.5^(n-5))
P(x=6) = (nC6) * (0.5^6) * (0.5^(n-6))
Step 4: Forming an Arithmetic Progression
We are given that P(x=4), P(x=5), and P(x=6) are in arithmetic progression.
Let the common difference be d.
P(x=5) - P(x=4) = d
P(x=6) - P(x=5) = d
Using the formulas derived earlier, we can substitute the values and solve for n:
[(nC5) * (0.5^5) * (0.5^(n-5))] - [(nC4) * (0.5^4) * (0.5^(n-4))] = d
[(nC6) * (0.5^6) * (0.5^(n-6))] - [(nC5) * (0.5^5) * (0.5^(n-5))] = d
Simplifying these equations will give us a relationship between n and d.
Step 5: Solving for n
To solve for n, we can substitute d = P(x=5) - P(x=4) into the equation [(nC5)
If the regression line of Y on X is Y = 30 - 0.9X and the standard deviations are Sx = 2 and Sy = 9, then the value of the correlation coefficient rxy is:- a)-0.3
- b)-0.2
- c)0.2
- d)0.3
Correct answer is option 'B'. Can you explain this answer?
If the regression line of Y on X is Y = 30 - 0.9X and the standard deviations are Sx = 2 and Sy = 9, then the value of the correlation coefficient rxy is:
a)
-0.3
b)
-0.2
c)
0.2
d)
0.3
|
|
Crack Gate answered |
The regression line of Y on X is Y = 30 - 0.9x
⇒ Y - 30 = - 0.9x
The regression equation line of Y on X is = y - y1 = r(sy/sx)(x - x1)
Comparing both equations, we get
⇒ r(sy/sx) = -0.9
⇒ r(9/2) = -0.9
⇒ r = (-0/9 × 2)/9 = - 0.2
∴ The value of the correlation coefficient rxy is -0.2
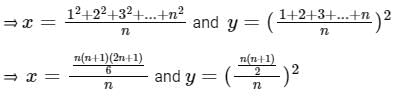
Let x be the mean of squares of first n natural numbers and y be the square of mean of first n natural numbers. If x/y = 55/42 , then what is the value of n ?- a)24
- b)25
- c)27
- d)30
Correct answer is option 'C'. Can you explain this answer?
Let x be the mean of squares of first n natural numbers and y be the square of mean of first n natural numbers. If x/y = 55/42 , then what is the value of n ?
a)
24
b)
25
c)
27
d)
30
|
|
Sanya Agarwal answered |
Concept:
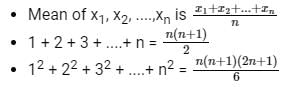
Calculation:
Given: x is the mean of squares of first n natural numbers and y is the square of mean of first n natural numbers
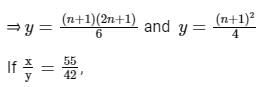
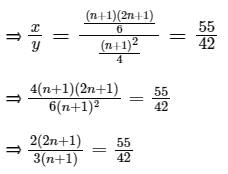
⇒ 2 x 42(2n + 1) = 3 x 55(n + 1)
⇒ 168n + 84 = 165n + 165
⇒ 3n = 81
⇒ n = 27
∴ The correct option is (3).
Calculation:
Given: x is the mean of squares of first n natural numbers and y is the square of mean of first n natural numbers
⇒ 2 x 42(2n + 1) = 3 x 55(n + 1)
⇒ 168n + 84 = 165n + 165
⇒ 3n = 81
⇒ n = 27
∴ The correct option is (3).
Consider a random variable Xthat takes values +1 and -1 with probability 0.5 each. The values of the cumulative distribution function F(x) at x = -1 and +1 are- a)0 and 0.5
- b)0 and 1
- c)0.5 and 1
- d)0.25 and 0.75
Correct answer is option 'C'. Can you explain this answer?
Consider a random variable Xthat takes values +1 and -1 with probability 0.5 each. The values of the cumulative distribution function F(x) at x = -1 and +1 are
a)
0 and 0.5
b)
0 and 1
c)
0.5 and 1
d)
0.25 and 0.75
|
|
Madhurima Kumar answered |
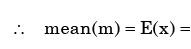
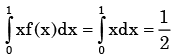
The p.d.t of the random variable is

The cumulative distribution function F(x) is the probability uptox as given below:
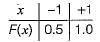
The cumulative distribution function F(x) is the probability uptox as given below:
Seven (distinct) car accidents occurred in a week. What is the probability that they all occurred on the same day?- a)1/77
- b)1/76
- c)1/27
- d)7/27
Correct answer is option 'B'. Can you explain this answer?
Seven (distinct) car accidents occurred in a week. What is the probability that they all occurred on the same day?
a)
1/77
b)
1/76
c)
1/27
d)
7/27
|
|
Rohan Kumar answered |
Sample space = 77
All accidents on the same day = 7 ways (all on Monday, all on Tuesday...)
So, required probability
All accidents on the same day = 7 ways (all on Monday, all on Tuesday...)
So, required probability
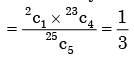
There are 25 calculators in a box. Two of them are defective. Suppose 5 calculators are randomly picked for inspection (i.e., each has the same chance of being selected), what is the probability that only one of the defective calculators will be included in the inspection?- a)1/2
- b)1/3
- c)1/4
- d)1/5
Correct answer is option 'B'. Can you explain this answer?
There are 25 calculators in a box. Two of them are defective. Suppose 5 calculators are randomly picked for inspection (i.e., each has the same chance of being selected), what is the probability that only one of the defective calculators will be included in the inspection?
a)
1/2
b)
1/3
c)
1/4
d)
1/5
|
|
Keerthana Joshi answered |
Probability of only one is defective out of 5 calculators
Consider the following grouped frequency distribution:
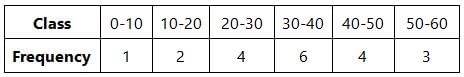 What is the median of the distribution ?
- a)34
- b)34.5
- c)35
- d)35.5
Correct answer is option 'C'. Can you explain this answer?
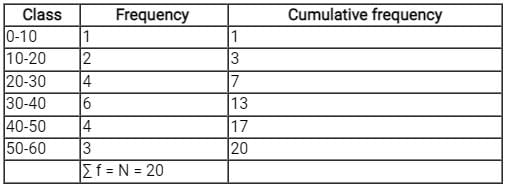
Consider the following grouped frequency distribution:
What is the median of the distribution ?
a)
34
b)
34.5
c)
35
d)
35.5
|
|
Engineers Adda answered |
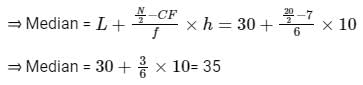
For a distribution, Median
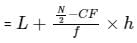
where, L = lower class limit of median class
N = Sum of frequencies
CF = cumulative frequency of class preceding the median class
f = frequency of median class
h = class length of median class.
where, L = lower class limit of median class
N = Sum of frequencies
CF = cumulative frequency of class preceding the median class
f = frequency of median class
h = class length of median class.
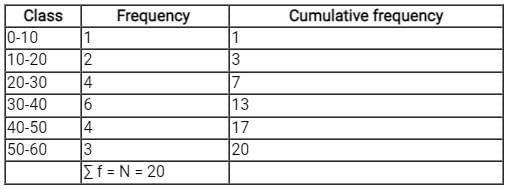
∑f = N = 20
⇒ N/2 = 10
As 7 < 10 < 13, N/2 lies in the class length 30 - 40 by comparing cumulative frequency.
Median class = 30 - 40
⇒ L = 30, N = 60, CF = 7, f = 6, h = 40 - 30 - 10
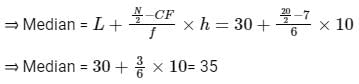
∴ The correct option is (3).
⇒ N/2 = 10
As 7 < 10 < 13, N/2 lies in the class length 30 - 40 by comparing cumulative frequency.
Median class = 30 - 40
⇒ L = 30, N = 60, CF = 7, f = 6, h = 40 - 30 - 10
∴ The correct option is (3).
Dimension reduction methods have the goal of using the correlation structure among the predictor variables to accomplish which of the following:A. To reduce the number of predictor componentsB. To help ensure that these components are dependentC. To provide a framework for interpretability of the resultsD. To help ensure that these components are independentE. To increase the number of predictor componentsChoose the correct answer from the options given below: - a)A, B, D and E only
- b)A, C and D only
- c)A, B, C and E only
- d)B, C, D and E only
Correct answer is option 'B'. Can you explain this answer?
Dimension reduction methods have the goal of using the correlation structure among the predictor variables to accomplish which of the following:
A. To reduce the number of predictor components
B. To help ensure that these components are dependent
C. To provide a framework for interpretability of the results
D. To help ensure that these components are independent
E. To increase the number of predictor components
Choose the correct answer from the options given below:
a)
A, B, D and E only
b)
A, C and D only
c)
A, B, C and E only
d)
B, C, D and E only
|
|
Engineers Adda answered |
The correct answer is Options A, C, and D only.
- Option A: Dimension reduction methods are used to reduce the number of predictor components. This is done by identifying the underlying patterns in the data and then representing the data in a lower-dimensional space.
- Option C: Dimension reduction methods can provide a framework for interpretability of the results. This is because it can help to simplify the data and make it easier to understand the relationships between the variables.
- Option D: Dimension reduction methods can help to ensure that these components are independent. This is because the goal of dimension reduction is to identify the underlying patterns in the data, and independent components do not share any common patterns.
- Option B is incorrect because dimension reduction methods do not necessarily ensure that the components are dependent. In fact, the goal of dimension reduction is to identify the underlying patterns in the data, and independent components do not share any common patterns.
- Option E is incorrect because dimension reduction methods are used to reduce the number of predictor components, not increase them
Consider the following grouped frequency distribution: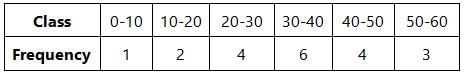 What is mean deviation about the median ?
- a)11.4
- b)11.1
- c)10.8
- d)10.5
Correct answer is option 'D'. Can you explain this answer?
Consider the following grouped frequency distribution:
What is mean deviation about the median ?
a)
11.4
b)
11.1
c)
10.8
d)
10.5
|
|
Sanvi Kapoor answered |
∑f = N = 20
⇒ N/2 = 10
As 7 < 10 < 13, N/2 lies in the class length 30 - 40 by comparing cumulative frequency.
Median class = 30 - 40
⇒ L = 30, N = 60, CF = 7, f = 6, h = 40 - 30 - 10
Now calculating mean deviation about median,
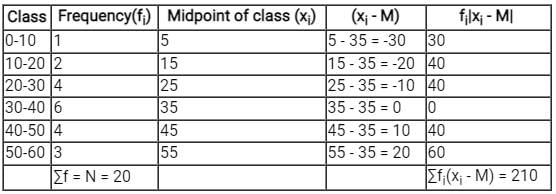
⇒ Mean deviation about median
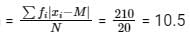
∴ The correct option is (4).
⇒ N/2 = 10
As 7 < 10 < 13, N/2 lies in the class length 30 - 40 by comparing cumulative frequency.
Median class = 30 - 40
⇒ L = 30, N = 60, CF = 7, f = 6, h = 40 - 30 - 10
Now calculating mean deviation about median,
⇒ Mean deviation about median
∴ The correct option is (4).
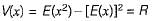
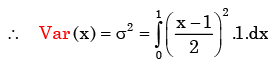
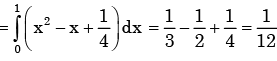
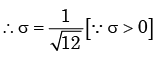
If the difference between the expectation of the square of a random variable (E[x2] and the square of the expectation of the random variable (E[x])2 is denoted by R, then
- a)R = 0
- b)R < 0
- c)R ≥ 0
- d)R > 0
Correct answer is option 'C'. Can you explain this answer?
If the difference between the expectation of the square of a random variable (E[x2] and the square of the expectation of the random variable (E[x])2 is denoted by R, then
a)
R = 0
b)
R < 0
c)
R ≥ 0
d)
R > 0
|
|
Srishti Yadav answered |
Random variable assigns a real number to each possible outcome.
Let X be a discreet random variable,then
where V(x) is the variance of x,
Explanation:
- The difference between the expectation of the square of a random variable (E[X2]) and the square of the expectation of the random variable (E[X])2 is called the variance of a random variable
- Variance measure how far a set of numbers is spread out
- A variance of zero(R=0) indicates that all the values are identical
- A variance of X = R =E[X2]- (E[X])2 This quantity is always non-negative as it is an expectation of a non-negative quantity
- A non-zero variance is always positive means R > 0
So, R ≥ 0 is the answer. Since variance is  and hence never negative,
and hence never negative, 
From a pack of regular from a playing cards, two cards are drawn at random. What is the probability that both cards will be Kings, if first card in NOT replaced - a)1/26
- b)1/52
- c)1/169
- d)1/221
Correct answer is option 'D'. Can you explain this answer?
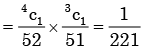
From a pack of regular from a playing cards, two cards are drawn at random. What is the probability that both cards will be Kings, if first card in NOT replaced
a)
1/26
b)
1/52
c)
1/169
d)
1/221
|
|
Sanskriti Chakraborty answered |
Here sample space S = 52
∴The probability of drawing both cards are king without replacement
If P(A) = 7/11, P(B) = 6 / 11 and P(A∪B) = 8/11, then P(A|B) = ________
- a)1
- b)2/3
- c)1/2
- d)5/6
Correct answer is option 'D'. Can you explain this answer?
If P(A) = 7/11, P(B) = 6 / 11 and P(A∪B) = 8/11, then P(A|B) = ________
a)
1
b)
2/3
c)
1/2
d)
5/6
|
|
Rounak Saini answered |
Understanding the Problem
To find P(A|B), we can use the formula for conditional probability:
P(A|B) = P(A ∩ B) / P(B)
Where:
- P(A|B) is the probability of A given B.
- P(A ∩ B) is the probability of both A and B occurring.
- P(B) is the probability of B.
Given Values
- P(A) = 7/11
- P(B) = 6/11
- P(A ∪ B) = 8/11
Finding P(A ∩ B)
Using the formula for the union of two events:
P(A ∪ B) = P(A) + P(B) - P(A ∩ B)
We can rearrange this to find P(A ∩ B):
P(A ∩ B) = P(A) + P(B) - P(A ∪ B)
Now substituting the provided values:
P(A ∩ B) = (7/11) + (6/11) - (8/11)
Calculating P(A ∩ B)
- Combine the fractions:
P(A ∩ B) = (7 + 6 - 8) / 11
P(A ∩ B) = 5/11
Calculating P(A|B)
Now, substitute P(A ∩ B) and P(B) into the conditional probability formula:
P(A|B) = P(A ∩ B) / P(B)
P(A|B) = (5/11) / (6/11)
This simplifies to:
P(A|B) = 5/6
Conclusion
The correct answer is option 'D' (5/6). This indicates that given event B has occurred, the probability of event A occurring is 5/6.
Analysis of variance is concerned with: - a)Determining change in a dependent variable per unit change in an independent variable
- b)Determining whether a qualitative factor affects the mean of an output variable
- c)Determining whether significant correlation exists between an output variable and an input variable.
- d)Determining whether variance in two or more populations are significantly different.
Correct answer is option 'D'. Can you explain this answer?
Analysis of variance is concerned with:
a)
Determining change in a dependent variable per unit change in an independent variable
b)
Determining whether a qualitative factor affects the mean of an output variable
c)
Determining whether significant correlation exists between an output variable and an input variable.
d)
Determining whether variance in two or more populations are significantly different.
|
|
Debolina Menon answered |
Analysis of variance is used in comparing two or more populations, e.g. Different types of manures for yelding a single crop.
A fair coin is tossed independently four times. The probability of the event “the number of time heads shown up is more than the number of times tails shown up” is - a)1/16
- b)1/8
- c)1/4
- d)5/16
Correct answer is option 'D'. Can you explain this answer?
A fair coin is tossed independently four times. The probability of the event “the number of time heads shown up is more than the number of times tails shown up” is
a)
1/16
b)
1/8
c)
1/4
d)
5/16
|
|
Niharika Iyer answered |
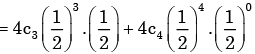
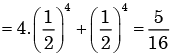
Here we have to find
P(H, H, H, T) + P(H, H, H, H)

If mean and mode of some data are 4 & 10 respectively, its median will be:- a)1.5
- b)5.3
- c)16
- d)6
Correct answer is option 'D'. Can you explain this answer?
If mean and mode of some data are 4 & 10 respectively, its median will be:
a)
1.5
b)
5.3
c)
16
d)
6
|
|
Sanya Agarwal answered |
Concept:
Mean: The mean or average of a data set is found by adding all numbers in the data set and then dividing by the number of values in the set.
Mode: The mode is the value that appears most frequently in a data set.
Median: The median is a numeric value that separates the higher half of a set from the lower half.
Relation b/w mean, mode and median:
Mode = 3(Median) - 2(Mean)
Calculation:
Given that,
mean of data = 4 and mode of data = 10
We know that
Mode = 3(Median) - 2(Mean)
⇒ 10 = 3(median) - 2(4)
⇒ 3(median) = 18
⇒ median = 6
Hence, the median of data will be 6.
Given that,
mean of data = 4 and mode of data = 10
We know that
Mode = 3(Median) - 2(Mean)
⇒ 10 = 3(median) - 2(4)
⇒ 3(median) = 18
⇒ median = 6
Hence, the median of data will be 6.
If X is a Poisson variate with P(X = 0) = 0.6, then the variance of X is:- a)In (1/5)
- b)log1015
- c)0
- d)ln 15
Correct answer is option 'A'. Can you explain this answer?
If X is a Poisson variate with P(X = 0) = 0.6, then the variance of X is:
a)
In (1/5)
b)
log1015
c)
0
d)
ln 15

|
Bayshore Academy answered |
Given
In Poisson distribution
P(X = 0) = 0.6
Formula
Poisson distribution is given by
f(x) = e-λλx/x!
Calculation
P(X = 0) = e-λλ0/0!
⇒ 0.6 = e-λ
⇒ 1/eλ = 6/10 = 3/5
⇒ eλ = 5/3
Taking log on both side
⇒ logeeλ = loge(5/3)
∴ λ = Loge(5/3)
In Standard normal distribution, the value of median is ___________- a)1
- b)0
- c)2
- d)Not fixed
Correct answer is option 'B'. Can you explain this answer?
In Standard normal distribution, the value of median is ___________
a)
1
b)
0
c)
2
d)
Not fixed

|
Arshiya Roy answered |
The correct answer is option 'B' (0).
Standard normal distribution, also known as the Z-distribution or the Gaussian distribution, is a specific type of normal distribution with a mean of 0 and a standard deviation of 1. It is symmetrical and bell-shaped.
In a standard normal distribution, the median is always equal to the mean, which is 0. This means that exactly half of the values in the distribution are below the median, and the other half are above it. The median is the value that separates the distribution into two equal parts.
Explanation:
1. Standard Normal Distribution:
- The standard normal distribution is a continuous probability distribution with a mean of 0 and a standard deviation of 1.
- It is often used in statistics and probability theory to analyze and describe various phenomena.
2. Median in a Distribution:
- The median is a measure of central tendency in a distribution.
- It represents the middle value when the data is arranged in ascending or descending order.
- In a symmetric distribution, the median is equal to the mean.
3. Symmetry of Standard Normal Distribution:
- The standard normal distribution is symmetric around its mean, which is 0.
- This means that the left and right tails of the distribution are mirror images of each other.
- The area under the curve to the left of the mean is equal to the area under the curve to the right of the mean.
4. Median and Mean in a Standard Normal Distribution:
- In a standard normal distribution, the mean is 0.
- Since the distribution is symmetric, the median is also 0.
- This implies that exactly half of the values in the distribution are below 0 and half are above 0.
In conclusion, the median value in a standard normal distribution is always 0 because of the symmetry of the distribution around its mean.
Normal Distribution is applied for ___________- a)Continuous Random Distribution
- b)Discrete Random Variable
- c)Irregular Random Variable
- d)Uncertain Random Variable
Correct answer is option 'A'. Can you explain this answer?
Normal Distribution is applied for ___________
a)
Continuous Random Distribution
b)
Discrete Random Variable
c)
Irregular Random Variable
d)
Uncertain Random Variable
|
|
Engineers Adda answered |
This is the rule on which Normal distribution is defined, no details on this as of why For more knowledge on this aspect, you can refer to any book or website which speaks on the same.
In Standard normal distribution, the value of mode is ___________- a)2
- b)1
- c)0
- d)Not fixed
Correct answer is option 'C'. Can you explain this answer?
In Standard normal distribution, the value of mode is ___________
a)
2
b)
1
c)
0
d)
Not fixed
|
|
Nishanth Banerjee answered |
Standard Normal Distribution
The standard normal distribution, also known as the Z-distribution or the Gaussian distribution, is a specific type of probability distribution. It is a continuous probability distribution defined over the entire real number line.
Mode of a Distribution
The mode of a distribution refers to the value or values that occur most frequently in the data. In other words, it represents the peak or the highest point in the distribution. A distribution can have multiple modes, in which case it is called a multimodal distribution.
Mode of the Standard Normal Distribution
In the case of the standard normal distribution, the mode is the value that occurs with the highest frequency. However, in the standard normal distribution, there is no single mode. This is because the standard normal distribution is symmetric and bell-shaped, with the peak occurring at the mean.
The mean of the standard normal distribution is zero, represented as μ = 0. This means that the distribution is perfectly balanced with equal probabilities on both sides of the mean. Therefore, there is no specific value that occurs more frequently than others, resulting in no fixed mode.
Graphical Representation
To visualize this concept, consider the standard normal distribution curve. It is symmetric around the mean, with the highest point or peak occurring at the mean. The curve tapers off on both sides and approaches zero as it extends towards positive and negative infinity.
Therefore, there is no single value that occurs more frequently than others, as the probabilities are evenly distributed. The mode is not fixed and can take any value. However, in this case, the mode is considered as zero.
Conclusion
In summary, the mode of the standard normal distribution is not fixed. It is a symmetric distribution with equal probabilities on both sides of the mean. The mode represents the value(s) that occur most frequently, but in the case of the standard normal distribution, there is no specific mode. The mode can be considered as zero, but it can also take any other value in theory.
In Normal distribution, the highest value of ordinate occurs at ___________- a)Mean
- b)Variance
- c)Extremes
- d)Same value occurs at all points
Correct answer is option 'A'. Can you explain this answer?
In Normal distribution, the highest value of ordinate occurs at ___________
a)
Mean
b)
Variance
c)
Extremes
d)
Same value occurs at all points
|
|
Crack Gate answered |
This is due the behaviour of the pdf of Normal distribution.
Chapter doubts & questions for Probability and Statistics - 6 Months Preparation for GATE CSE 2025 is part of Computer Science Engineering (CSE) exam preparation. The chapters have been prepared according to the Computer Science Engineering (CSE) exam syllabus. The Chapter doubts & questions, notes, tests & MCQs are made for Computer Science Engineering (CSE) 2025 Exam. Find important definitions, questions, notes, meanings, examples, exercises, MCQs and online tests here.
Chapter doubts & questions of Probability and Statistics - 6 Months Preparation for GATE CSE in English & Hindi are available as part of Computer Science Engineering (CSE) exam.
Download more important topics, notes, lectures and mock test series for Computer Science Engineering (CSE) Exam by signing up for free.
6 Months Preparation for GATE CSE
459 videos|1398 docs|786 tests
|
|
© EduRev
|
Education Revolution
|


|


Signup on EduRev and stay on top of your study goals
10M+ students crushing their study goals daily