


All Exams >
UPSC >
Electrical Engineering Optional Notes for UPSC >
All Questions
All questions of Nyquist's Criterion for UPSC CSE Exam
A Routh table is shown in fig. The location of pole on RHP, LHP and imaginary axis are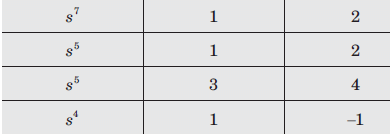
- a)1, 2, 4
- b)1, 6, 0
- c)1, 0, 6
- d)None of the above
Correct answer is 'A'. Can you explain this answer?
A Routh table is shown in fig. The location of pole on RHP, LHP and imaginary axis are
a)
1, 2, 4
b)
1, 6, 0
c)
1, 0, 6
d)
None of the above

|
Jaya Yadav answered |
If the system is given with the unbounded input then nothing can be clarified for the stability of the system.


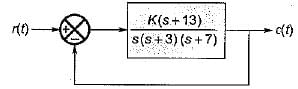
For which of the following values of K, the feedback system shown in the below figure is stable?
- a)K < 0
- b)K > 0
- c)0 < K < 54
- d)0 < K < 70
Correct answer is option 'D'. Can you explain this answer?
For which of the following values of K, the feedback system shown in the below figure is stable?
a)
K < 0
b)
K > 0
c)
0 < K < 54
d)
0 < K < 70
|
|
Rhea Reddy answered |
The characteristic equation is
1 + G (s) H (s) = 0
or,
1 + G (s) H (s) = 0
or,
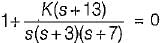
or, s3 + 10s2 + (21 + K )s + 13 K= 0
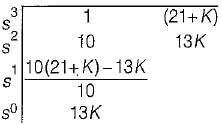
For stability, 13K > 0 or K > 0
Also,
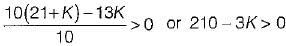
or, K < 70
Hence, 0 < K< 70 (For stability).
Consider the following statements regarding the characteristic equation of a system given by:
s4 + 5s3 + 25+10 = 0
1. The system is unstable.
2. The system is stable.
3. Number of roots with zero real part - 0
4. Number of roots with positive real part - 4
5. Number of roots with negative real part = 2
Which of the above statements are correct?- a)2 and 3
- b)1 and 3
- c)2, 3 and 4
- d)1, 3 and 5
Correct answer is option 'D'. Can you explain this answer?
Consider the following statements regarding the characteristic equation of a system given by:
s4 + 5s3 + 25+10 = 0
1. The system is unstable.
2. The system is stable.
3. Number of roots with zero real part - 0
4. Number of roots with positive real part - 4
5. Number of roots with negative real part = 2
Which of the above statements are correct?
s4 + 5s3 + 25+10 = 0
1. The system is unstable.
2. The system is stable.
3. Number of roots with zero real part - 0
4. Number of roots with positive real part - 4
5. Number of roots with negative real part = 2
Which of the above statements are correct?
a)
2 and 3
b)
1 and 3
c)
2, 3 and 4
d)
1, 3 and 5
|
|
Anirban Gupta answered |
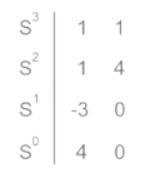
The Routh’s array is
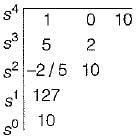
Since there are two sign changes in first column of Routh’s array, therefore the system is unstable.
Number of roots with positive real part = 2
Number of roots with negative real part = 2
Number of roots with zero real part = 0
Since there are two sign changes in first column of Routh’s array, therefore the system is unstable.
Number of roots with positive real part = 2
Number of roots with negative real part = 2
Number of roots with zero real part = 0
If the constant 'k' is negative, then what would be its contribution to the phase plot:- a)90 degrees
- b)45 degrees
- c)180 degrees
- d)0 degree
Correct answer is option 'C'. Can you explain this answer?
If the constant 'k' is negative, then what would be its contribution to the phase plot:
a)
90 degrees
b)
45 degrees
c)
180 degrees
d)
0 degree

|
Cstoppers Instructors answered |
Polar plot:
- The polar plot of a transfer function G(jω) is the plot of the magnitude of G(jω) versus the phase angle of G(jω) as ω is varied from 0 to positive infinity.
- For all pole systems, type indicates the starting point of the polar plot and order indicates the ending point of the polar plot.
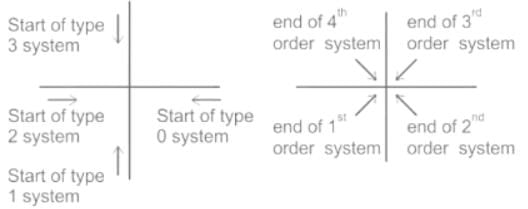
- As seen from the above figure, when a zero is added the type decreases, and the end of the polar plot shifts by +90°.
- When a pole is added, the type of the system increases, and hence the end of the polar plot shifts by -90°.
Calculation:
Let the transfer function be:
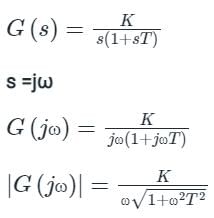
Let the transfer function be:
The total phase shift will be:
∠G(jω)H(jω) = -90° - tan-1(ωT) - 180° ----(1)
From equation (1) we can say that constant K has no contribution to the phase plot.
Hence K contributes 180° to the phase plot.
So option (c) is the correct answer.
∠G(jω)H(jω) = -90° - tan-1(ωT) - 180° ----(1)
From equation (1) we can say that constant K has no contribution to the phase plot.
Hence K contributes 180° to the phase plot.
So option (c) is the correct answer.
The transfer function of a system is 
The system is then which one of the following?- a)Non-minimum phase function
- b)Low-pass system
- c)Second-order system
- d)None of the above
Correct answer is option 'D'. Can you explain this answer?
The transfer function of a system is
The system is then which one of the following?
The system is then which one of the following?
a)
Non-minimum phase function
b)
Low-pass system
c)
Second-order system
d)
None of the above
|
|
Ashutosh Majumdar answered |
Since one pole (s .= 1) lies in RH s-plane, therefore the system is unstable.
Which of the following is the correct statement?
A minimum phase network is one whose transfer function has- a)zeros in the right hand s-plane and poles in the left hand s-plane.
- b)zeros and poles in the left hand s-plane.
- c)zeros in the left hand s-plane and poles in the right hand s-plane.
- d)arbitrary distribution of zeros and poles in the S-plane.
Correct answer is option 'B'. Can you explain this answer?
Which of the following is the correct statement?
A minimum phase network is one whose transfer function has
A minimum phase network is one whose transfer function has
a)
zeros in the right hand s-plane and poles in the left hand s-plane.
b)
zeros and poles in the left hand s-plane.
c)
zeros in the left hand s-plane and poles in the right hand s-plane.
d)
arbitrary distribution of zeros and poles in the S-plane.
|
|
Anjali Choudhury answered |
Explanation:
Minimum Phase Network:
A minimum phase network is a type of linear time-invariant (LTI) system in which all the zeroes and poles of the transfer function lie in the left-half of the s-plane. The transfer function of a minimum phase network is a causal and stable function that can be factored into a product of two terms: a minimum phase term and a delay term. The minimum phase term has all its zeroes and poles in the left-half of the s-plane, while the delay term has a pole at the origin.
Transfer Function:
The transfer function of a minimum phase network is given by:
H(s) = e^(-Ds) * G(s)
where D is a positive constant, G(s) is the minimum phase transfer function, and e^(-Ds) is the delay term. The transfer function H(s) can be expressed as a product of the minimum phase term G(s) and the delay term e^(-Ds). The minimum phase term G(s) is a causal and stable function that has all its zeroes and poles in the left-half of the s-plane. The delay term e^(-Ds) is a non-causal and unstable function that has a pole at the origin.
Properties of Minimum Phase Network:
The following are some of the properties of a minimum phase network:
- All the zeroes and poles of the transfer function lie in the left-half of the s-plane.
- The step response of a minimum phase network is faster than that of a non-minimum phase network with the same magnitude response.
- The phase response of a minimum phase network is always less than or equal to the phase response of a non-minimum phase network with the same magnitude response.
- The impulse response of a minimum phase network decays faster than that of a non-minimum phase network with the same magnitude response.
Answer:
Option 'B' is the correct statement. A minimum phase network is one whose transfer function has zeros and poles in the left-hand s-plane.
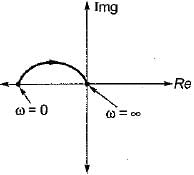
The inverse polar plot of the open loop transfer function, 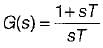 will be re presented by
- a)
- b)
- c)
- d)
Correct answer is option 'A'. Can you explain this answer?
The inverse polar plot of the open loop transfer function, will be re presented by
will be re presented bya)
b)
c)
d)
|
|
Lavanya Menon answered |
Given, G(s) = (1+sT)/(sT)
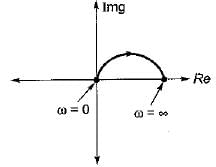
The inverse polar plot of G(jω) is the polar plot of 1/G(jω)
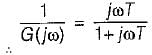
Thus,
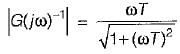
and
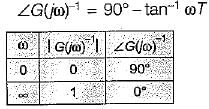
Hence, inverse polar plot will be as show below,
The inverse polar plot of G(jω) is the polar plot of 1/G(jω)
Thus,
and
Hence, inverse polar plot will be as show below,
According to Hurwitz criterion, the characteristic equation
s4 + 8s3 + 18s2 + 16s + 5 = 0 is
- a)Stable
- b)Marginally stable
- c)Conditionally stable
- d)None of these
Correct answer is option 'A'. Can you explain this answer?
According to Hurwitz criterion, the characteristic equation
s4 + 8s3 + 18s2 + 16s + 5 = 0 is
a)
Stable
b)
Marginally stable
c)
Conditionally stable
d)
None of these

|
Engineers Adda answered |
Concept:
The Routh Stability Criterion is used to test the stability of an LTI system. The conditions for stability are:
- All the coefficients of the characteristic Equation must be present and must have the same sign.
- It is necessary and sufficient that each term of the first column of the Routh Array of the Characteristic Equation is positive for the system to be stable, i.e. there should not be any sign changes in the first column of each row.
- The number of sign changes represents the number of roots on the right side of the s-plane.
- If the first term in any row of Routh Array is zero while the rest of the row has at least one non-zero term. Because of this term, the terms in the next row will become infinite.
- When all elements in any row of the Routh array are zero. This condition indicates that there are symmetrical/imaginary roots in the s-plane.
Application:
A(s) = s4 + 8s3 + 18s2 + 16s + 5
Forming the Routh array, we get:
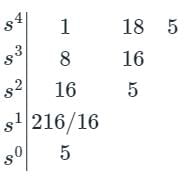
Since there are no sign changes in the first column of the Routh array, we conclude that the system is stable.
Consider a feedback system with gain margin of about 30. At what point does Nyquist plot crosses negative real axis?- a)-3
- b)-0.3
- c)-30
- d)-0.03
Correct answer is option 'B'. Can you explain this answer?
Consider a feedback system with gain margin of about 30. At what point does Nyquist plot crosses negative real axis?
a)
-3
b)
-0.3
c)
-30
d)
-0.03
|
|
Sharmila Kulkarni answered |
Nyquist Plot and Gain Margin
Nyquist plot is a graphical representation of a system's frequency response. It is used to analyze the stability of a feedback system. The Nyquist plot is a plot of the frequency response of a system in the complex plane. The gain margin of a feedback system is the amount of gain that the system can handle before it becomes unstable. It is defined as the amount of gain that causes the Nyquist plot to cross the negative real axis.
Answer Explanation
Given that the gain margin of the feedback system is about 30, we can determine at what point the Nyquist plot crosses the negative real axis by using the Nyquist stability criterion. The Nyquist stability criterion states that the number of encirclements of the -1 point in the Nyquist plot is equal to the number of unstable poles of the closed-loop transfer function.
Since the gain margin is about 30, the Nyquist plot will cross the negative real axis at a point where the magnitude of the complex number is equal to 1/30. This is because the gain margin is the reciprocal of the point where the Nyquist plot crosses the negative real axis. Therefore, the Nyquist plot will cross the negative real axis at a frequency of -0.3, which corresponds to a magnitude of 1/30.
Thus, the correct answer is option B, -0.3.
Consider the following statements related to Routh-Hurwitz criterion of determining the stability of a system:
1. It is applicable if the characteristic equation has real coefficients, complex ternrivS or exponential functions of s.
2. The criterion can be applied to any stability boundaries in complex plane, such as the unit circle in the z-plane.
3. The number of changes of signs in the elements of the first column equals the number of roots with negative real parts.
Which of these statements is/are not correct?- a)2 and 3 oniy .
- b)1, 2 and 3
- c)1 only
- d)1 and 2 only
Correct answer is option 'B'. Can you explain this answer?
Consider the following statements related to Routh-Hurwitz criterion of determining the stability of a system:
1. It is applicable if the characteristic equation has real coefficients, complex ternrivS or exponential functions of s.
2. The criterion can be applied to any stability boundaries in complex plane, such as the unit circle in the z-plane.
3. The number of changes of signs in the elements of the first column equals the number of roots with negative real parts.
Which of these statements is/are not correct?
a)
2 and 3 oniy .
b)
1, 2 and 3
c)
1 only
d)
1 and 2 only
|
|
Athul Banerjee answered |
• Routh-Hurwitz criterion is not applicable if characteristic equation has coefficients which are exponential or complex.
• It is not applied in z-piane because z-piane having unit circle is the stability boundary of discrete-data system.
• Statement-3 is also false because no. of sign change in 1st column of Routh’s array indicates the number of roots with positive real part or roots lying in RH s-plane.
• It is not applied in z-piane because z-piane having unit circle is the stability boundary of discrete-data system.
• Statement-3 is also false because no. of sign change in 1st column of Routh’s array indicates the number of roots with positive real part or roots lying in RH s-plane.
The characteristic equation of a second order discrete-data system is given by:
F(z) = z2+ z+ 0.25 = 0
The above system is- a)stable
- b)marginally stable
- c)unstable
- d)asymptotically stable
Correct answer is option 'A'. Can you explain this answer?
The characteristic equation of a second order discrete-data system is given by:
F(z) = z2+ z+ 0.25 = 0
The above system is
F(z) = z2+ z+ 0.25 = 0
The above system is
a)
stable
b)
marginally stable
c)
unstable
d)
asymptotically stable
|
|
Nilesh Joshi answered |
For a second order discrete- data system given by:
F(z) = a2z2 + a1z + a0 = 0
to be stable, the necessary and sufficient conditions are:
F(1) > 0
F(-1) > 0 and |a0| < a2
Here, F(z) = z2 + z + 0.25
So, = 0.25, a1 = 1, a2 = 1
Thus, F(1) - 12+ 1 + 0.25 = 2.25 > 0
F(-1) = 1 -1 + 0.25 = 0.25 > 0
and la0l = 0.25 < a2 = 1 Since ail the conditions are satisfied, therefore given system is stable.
The characteristic equation of a closed loop control system is given by:
s2 + 2s +10 + K(s2 + 6s + 10) = 0
The angle of asymptotes for the root loci for K > 0 are given by- a)180°, 360°
- b)90°, 270°
- c)90°, 180°
- d)none of these
Correct answer is option 'D'. Can you explain this answer?
The characteristic equation of a closed loop control system is given by:
s2 + 2s +10 + K(s2 + 6s + 10) = 0
The angle of asymptotes for the root loci for K > 0 are given by
s2 + 2s +10 + K(s2 + 6s + 10) = 0
The angle of asymptotes for the root loci for K > 0 are given by
a)
180°, 360°
b)
90°, 270°
c)
90°, 180°
d)
none of these
|
|
Saumya Basak answered |
Given, s2 + 2s + 10 + K(s2 + 6s + 10) = 0
or,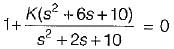
or, 1 + G(s)H(s) = 0
Thus, G(s)H(s) =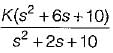
Here, number of open loop poles, P = 2. Number of open loop zero, Z = 2
∴ P - Z = 0.
Angle of asymptotes are given by:
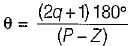
Sines P - Z= 0, therefore there are no angle of asymptotes for the root locus of the given system.
or,
or, 1 + G(s)H(s) = 0
Thus, G(s)H(s) =
Here, number of open loop poles, P = 2. Number of open loop zero, Z = 2
∴ P - Z = 0.
Angle of asymptotes are given by:
Sines P - Z= 0, therefore there are no angle of asymptotes for the root locus of the given system.
What is the stability of the system s3 + s2 + s + 4 = 0 using Hurwitz criteria?- a)Unstable
- b)Stable
- c)Critically stable
- d)Marginally stable
Correct answer is option 'A'. Can you explain this answer?
What is the stability of the system s3 + s2 + s + 4 = 0 using Hurwitz criteria?
a)
Unstable
b)
Stable
c)
Critically stable
d)
Marginally stable
|
|
Engineers Adda answered |
Concept:
To find the closed system stability by using RH criteria we require a characteristic equation.
Whereas in remaining all stability techniques we require open-loop transfer function.
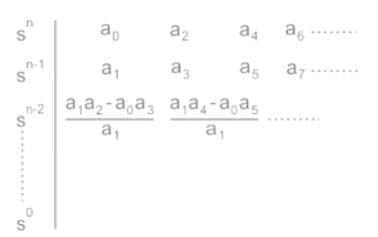
The nth order general form of CE is a0 sn + a1 sn-1 + a2sn-2 + __________an-1 s1 +
an RH table shown below:
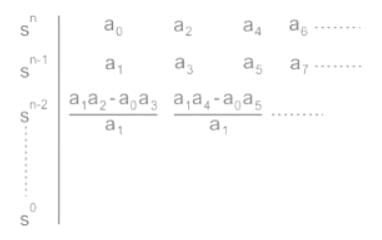
Necessary condition
All the coefficients of the characteristic equation should be positive and real.
Sufficient Conditions for stability:
1. All the coefficients in the first column should have the same sign and no coefficient should be zero.
2. If any sign changes in the first column, the system is unstable. And the number of sign changes = Number of poles in right of s-plane.
Calculation:
With the help of the
Routh table explained in the concept we can extend the calculation.
So in the first column, there are two sign changes, the system is unstable
From the below given Nyquist plot, calculate the number of open-loop poles on the right-hand side of the s-plane for the closed-loop system to be stable.
- a)1
- b)2
- c)0
- d)-1
Correct answer is option 'A'. Can you explain this answer?
From the below given Nyquist plot, calculate the number of open-loop poles on the right-hand side of the s-plane for the closed-loop system to be stable.
a)
1
b)
2
c)
0
d)
-1
|
|
Ravi Singh answered |
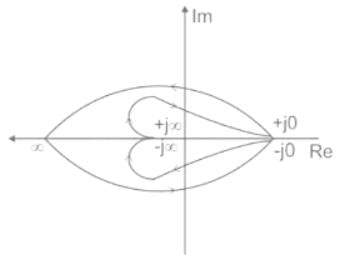
Principle arguments
- It states that if there are “P” poles and “Z” zeroes for a closed, random selected path then the corresponding G(s)H(s) plane encircles the origin with P – Z times.
- Encirclements in s – plane and GH – plane are shown below.
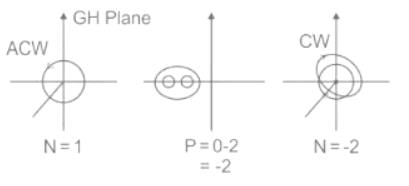
- In GH plane Anti clockwise encirclements are taken as positive and clockwise encirclements are taken as negative.
It is applied to the total RH plane by selecting a closed path with r = ∞
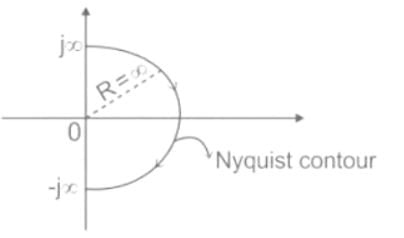
Nyquist stability completely deals with the right half of s – plane.
N(0, 0) = P – Z
N(0, 0): Number of encirclements around critical point (- 1, 0)
N(0, 0) = P – Z
N(0, 0): Number of encirclements around critical point (- 1, 0)
P: Open loop poles
Z: Open-loop zeroes.
Note:
1) To get the Closed-loop stability we require 1 + GH plane but available is GH plane, hence the origin is shifted to “-1” to get the closed-loop stability.
2) To become the system stable there should not be any closed-loop pole in the right of s – plane.
3) The closed-loop pole is the same as that of the zeroes of Characteristic Equation which must be zero in the right. i.e, Z = 0
N = P is the criteria.
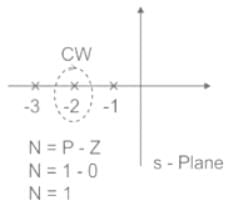
Calculation:
From the given Nyquist plot there is one encirclement about ( -1, 0 ) in the Anti-clockwise direction.
So, N = 1
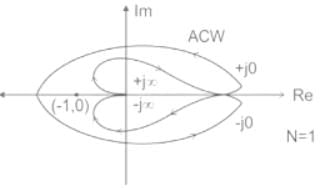
Now to satisfy the stability criteria N should be equal to P.
N = P = 1
So the number of open-loop poles in the Right-hand side of the system is 1.
Routh Hurwitz criterion is used to determine- a)peak response of the system
- b)time response of the system
- c)absolute stability of the system
- d)roots of the characteristic equation graphically
Correct answer is option 'C'. Can you explain this answer?
Routh Hurwitz criterion is used to determine
a)
peak response of the system
b)
time response of the system
c)
absolute stability of the system
d)
roots of the characteristic equation graphically
|
|
Engineers Adda answered |
Routh-Hurwitz criterion:
- Using the Routh-Hurwitz method, the stability information can be obtained without the need to solve the closed-loop system poles. This can be achieved by determining the number of poles that are in the left-half or right-half plane and on the imaginary axis.
- This involves checking the roots of the characteristic polynomial of a linear system to determine its stability.
- It is used to determine the absolute stability of a system.
Important points
Other methods of determining stability include:
Root locus:
- This method gives the position of the roots of the characteristic equation as the gain K is varied.
- With Root locus (unlike the case with Routh-Hurwitz criterion), we can do both analysis (i.e., for each gain value we know where the closed-loop poles are) and design (i.e., on the curve we can search for a gain value that results in the desired closed-loop poles).
Nyquist plot:
- This method is mainly used for assessing the stability of a system with feedback.
- While Nyquist is a graphical technique, it only provides a limited amount of intuition for why a system is stable or unstable, or how to modify an unstable system to be stable.
Techniques like Bode plots, while less general, are sometimes a more useful design tool.
The characteristic equation of a system is given by s3 + s + 2 - 0.What are the number of roots in the right half s-plane and on the jω-axis respectively?- a)3, 0
- b)2, 1
- c)1,2
- d)2,0
Correct answer is option 'D'. Can you explain this answer?
The characteristic equation of a system is given by s3 + s + 2 - 0.
What are the number of roots in the right half s-plane and on the jω-axis respectively?
a)
3, 0
b)
2, 1
c)
1,2
d)
2,0
|
|
Manisha Rane answered |
The characteristic equation of the system is given by:
s^3 + s + 2 = 0
To determine the number of roots in the right half s-plane, we need to evaluate the real parts of the roots. Since the equation is a third-degree polynomial, it can have up to three roots.
To find the roots, we can use the Routh-Hurwitz stability criterion. This method involves creating a Routh array using the coefficients of the characteristic equation:
1 2
1 0
2
To determine the number of roots in the right half s-plane, we count the number of sign changes in the first column of the Routh array. In this case, there is one sign change (from 1 to 2), so there is one root in the right half s-plane.
To determine the number of roots on the jω-axis, we count the number of sign changes in the first column of the Routh array after substituting jω for s. In this case, there are no sign changes, so there are no roots on the jω-axis.
The gain margin for the system with open loop transfer function G(s) H(s) = G(s) = 2(1 + s) / s2 is- a)8
- b)0
- c)1
- d)-8
Correct answer is option 'B'. Can you explain this answer?
The gain margin for the system with open loop transfer function G(s) H(s) = G(s) = 2(1 + s) / s2 is
a)
8
b)
0
c)
1
d)
-8
|
|
Mainak Roy answered |
Open Loop Transfer Function:
The open-loop transfer function of a control system is the transfer function obtained by removing the feedback loop from the system. In this case, the open-loop transfer function is given as:
G(s) = 2(1 - s) / s^2
Gain Margin:
The gain margin is a measure of the system's stability and indicates how much the system's gain can be increased before it becomes unstable. It is defined as the amount of gain at the frequency where the phase of the open-loop transfer function is -180 degrees.
Phase of the Open Loop Transfer Function:
To determine the gain margin, we first need to find the frequency at which the phase of the open-loop transfer function is -180 degrees.
The phase of the open-loop transfer function can be calculated as follows:
Phase = angle(2(1 - s) / s^2)
To find the frequency at which the phase is -180 degrees, we set the phase equal to -180 degrees and solve for s:
-180 = angle(2(1 - s) / s^2)
Finding the Gain Margin:
Once we have found the frequency at which the phase is -180 degrees, we can calculate the gain margin.
The gain margin is given by the reciprocal of the magnitude of the open-loop transfer function at the frequency where the phase is -180 degrees:
Gain Margin = 1 / |G(jω)|
where ω is the frequency at which the phase is -180 degrees.
In this case, since the open-loop transfer function is a rational function, we can substitute jω for s to determine the frequency at which the phase is -180 degrees.
By substituting jω for s in the open-loop transfer function G(s), we can calculate the magnitude of G(jω) at the frequency where the phase is -180 degrees:
|G(jω)| = |2(1 - jω) / (jω)^2|
Simplifying this expression, we get:
|G(jω)| = |2(1 - jω) / -ω^2|
To find the gain margin, we substitute -180 degrees for the phase, calculate the magnitude of the open-loop transfer function at that frequency, and take the reciprocal:
Gain Margin = 1 / |G(jω)|
By performing the calculations, we find that the gain margin is 0.
Therefore, the correct answer is option 'B', 0.
The characteristic polynomial of a linear system is given as s4 + 3s3 + 5s2 + 6s + K + 10 = 0. What should be the condition on K so that the system is stable?- a)-10 < K < -4
- b)K > 10
- c)K > -4
- d)K > -10
Correct answer is option 'A'. Can you explain this answer?
The characteristic polynomial of a linear system is given as s4 + 3s3 + 5s2 + 6s + K + 10 = 0. What should be the condition on K so that the system is stable?
a)
-10 < K < -4
b)
K > 10
c)
K > -4
d)
K > -10
|
|
Engineers Adda answered |
Concept:
The characteristic equation for a given open-loop transfer function G(s) is
1 + G(s) H(s) = 0
To find the closed system stability by using RH criteria we require a characteristic equation. Whereas in remaining all stability techniques we require open-loop transfer function.
The nth order general form of CE is

RH table shown below:
Necessary condition: All the coefficients of the characteristic equation should be positive and real.
Sufficient Conditions for stability:
1. All the coefficients in the first column should have the same sign and no coefficient should be zero.
2. If any sign changes in the first column, the system is unstable.
And the number of sign changes = Number of poles in right of s-plane.
Calculation:
Characteristic equation: s4 + 3s3 + 5s2 + 6s + K + 10 = 0
By applying Routh tabulation method,
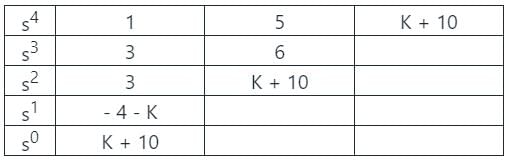
The system to become stable, the sign changes in the first column of the Routh table must be zero.
- 4 - K > 0 and K + 10 > 0
4 + K < 0 and K + 10 > 0
K < - 4 and K > - 10
⇒ - 10 < K < - 4
If the Nyquist plot cuts the negative real axis at a distance of 0.25, then the gain margin and phase margin of the system will be respectively- a)0.25 and 0°
- b)4.0 and -180°
- c)-0.25 and 180°
- d)4.0 and 0°
Correct answer is option 'D'. Can you explain this answer?
If the Nyquist plot cuts the negative real axis at a distance of 0.25, then the gain margin and phase margin of the system will be respectively
a)
0.25 and 0°
b)
4.0 and -180°
c)
-0.25 and 180°
d)
4.0 and 0°
|
|
Anshika Nambiar answered |
B) 0.25 and 180 degrees
If the gain of the open-loop system is increased to four times, the gain margin of the system- a)remains same
- b)becomes half
- c)becomes one-fourth
- d)none of the above
Correct answer is option 'C'. Can you explain this answer?
If the gain of the open-loop system is increased to four times, the gain margin of the system
a)
remains same
b)
becomes half
c)
becomes one-fourth
d)
none of the above
|
|
Avik Iyer answered |
Understanding Gain Margin
Gain margin is a crucial concept in control systems that indicates the stability of a system. It is defined as the amount by which the gain can be increased before the system becomes unstable.
Effect of Increasing Gain
When the open-loop gain of a system is increased, the system's response characteristics change significantly. Specifically, if the gain is quadrupled, the following occurs:
- Gain Margin Calculation: Gain margin is inversely related to the gain of the system. Mathematically, if the gain is increased, the gain margin diminishes proportionally.
- Gain Increase Factor: By increasing the gain to four times the original, the new gain margin becomes one-fourth of the original gain margin.
Conclusion on Gain Margin
Therefore, if the gain of the open-loop system is increased to four times, the gain margin of the system indeed becomes:
- One-Fourth of the Original: This reduction in gain margin indicates that the system has become closer to instability.
In summary, the correct answer is option 'C', as increasing the gain to four times results in the gain margin becoming one-fourth of its initial value. Understanding this relationship is vital for ensuring system stability in control engineering.
Consider the following statements:
Nichol’s chart gives information about.
i. Closed loop frequency response.
ii. The value of the peak magnitude of the closed loop frequency response Mp.
iii. The frequency at which Mp occurs.
Which of the above statements are correct?- a)2 and 3
- b)1 and 2
- c)1 and 3
- d)1,2 and 3
Correct answer is option 'D'. Can you explain this answer?
Consider the following statements:
Nichol’s chart gives information about.
i. Closed loop frequency response.
ii. The value of the peak magnitude of the closed loop frequency response Mp.
iii. The frequency at which Mp occurs.
Which of the above statements are correct?
Nichol’s chart gives information about.
i. Closed loop frequency response.
ii. The value of the peak magnitude of the closed loop frequency response Mp.
iii. The frequency at which Mp occurs.
Which of the above statements are correct?
a)
2 and 3
b)
1 and 2
c)
1 and 3
d)
1,2 and 3
|
|
Sarita Yadav answered |
Nichol’s chart gives information about closed loop frequency response, value of the peak magnitude of the closed loop frequency response Mp and the frequency at which Mp occurs.
In the formation of Routh-Hurwitz array for a polynomial, all the elements of a row have zero values. This premature termination of the array indicates the presence of1. a pair of real roots with opposite sign2. complex conjugate roots on the imaginary axis3. a pair of complex conjugate roots with opposite real partsWhich of the above statements are correct?- a)Only 2
- b)2 and 3
- c)Only 3
- d)1, 2 and 3
Correct answer is option 'D'. Can you explain this answer?
In the formation of Routh-Hurwitz array for a polynomial, all the elements of a row have zero values. This premature termination of the array indicates the presence of
1. a pair of real roots with opposite sign
2. complex conjugate roots on the imaginary axis
3. a pair of complex conjugate roots with opposite real parts
Which of the above statements are correct?
a)
Only 2
b)
2 and 3
c)
Only 3
d)
1, 2 and 3
|
|
Engineers Adda answered |
Routh-Hurwitz Stability Criterion: It is used to test the stability of an LTI system.
The characteristic equation for a given open-loop transfer function G(s) is
1 + G(s) H(s) = 0
According to the Routh tabulation method,
The system is said to be stable if there are no sign changes in the first column of the Routh array
The number of poles lies on the right half of s plane = number of sign changes
A row of zeros in a Routh table:
This situation occurs when the characteristic equation has
- a pair of real roots with opposite sign (±a)
- complex conjugate roots on the imaginary axis (± jω)
- a pair of complex conjugate roots with opposite real parts (-a ± jb, a ± jb)
The procedure to overcome this as follows:
- Form the auxiliary equation from the preceding row to the row of zeros
- Complete Routh array by replacing the zero row with the coefficients obtained by differentiating the auxiliary equation.
- The roots of the auxiliary equation are also the roots of the characteristic equation.
- The roots of the auxiliary equation occur in pairs and are of the opposite sign of each other.
- The auxiliary equation is always even in order.
All the constant N-circles in G planes cross the real axis at the fixed points. Which are these points?- a)-1 and origin
- b)Origin and +1
- c)-0.5 and 0.5
- d)-1 and +1
Correct answer is option 'A'. Can you explain this answer?
All the constant N-circles in G planes cross the real axis at the fixed points. Which are these points?
a)
-1 and origin
b)
Origin and +1
c)
-0.5 and 0.5
d)
-1 and +1
|
|
Sarita Yadav answered |
Centre of N circle is (-1/2, 1/2N)
N = tanα
Constant –N circles always pass through (-1, 0) and (0, 0).
N = tanα
Constant –N circles always pass through (-1, 0) and (0, 0).
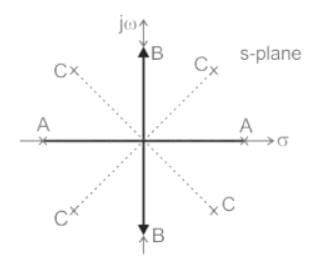
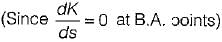
Assertion (A): From the root sensitivity standpoint, a system should not be operated at the breakaway points.
Reason (R): The root sensitivity at the breakaway points is zero.- a)Both A and R are true and R is a correct explanation of A.
- b)Both A and R are true but R is not a correct explanation of A.
- c)A is true but R is false.
- d)A is false but R is true.
Correct answer is option 'C'. Can you explain this answer?
Assertion (A): From the root sensitivity standpoint, a system should not be operated at the breakaway points.
Reason (R): The root sensitivity at the breakaway points is zero.
Reason (R): The root sensitivity at the breakaway points is zero.
a)
Both A and R are true and R is a correct explanation of A.
b)
Both A and R are true but R is not a correct explanation of A.
c)
A is true but R is false.
d)
A is false but R is true.
|
|
Sakshi Roy answered |
From the root sensitivity, standpoint, a system should not be operated at1the breakaway points because root sensitivity at breakaway point is infinite.
i.e.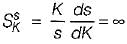
at breakaway points
Here, α = closed loop poles(s)
and β = system gain (K)
Thus,
or,
i.e.
at breakaway points
Here, α = closed loop poles(s)
and β = system gain (K)
Thus,
or,
What is the value of M for the constant M circle represented by the equation 8x2 + 18x + 8y2 + 9 = 0?- a)0.5
- b)2
- c)3
- d)8
Correct answer is option 'C'. Can you explain this answer?
What is the value of M for the constant M circle represented by the equation 8x2 + 18x + 8y2 + 9 = 0?
a)
0.5
b)
2
c)
3
d)
8
|
|
Sarita Yadav answered |
Comparing with the M circle equation we have the value of M = 3.
If a system has an open loop transfer function 1-s / 1+s, then the gain of the system at frequency of 1 rad/s will be- a)1
- b)1/2
- c)Zero
- d)-1
Correct answer is option 'D'. Can you explain this answer?
If a system has an open loop transfer function 1-s / 1+s, then the gain of the system at frequency of 1 rad/s will be
a)
1
b)
1/2
c)
Zero
d)
-1
|
|
Anuj Rane answered |
Open Loop Transfer Function
The open loop transfer function of a system represents the relationship between the input and output of a system without any feedback. It is denoted by G(s) and is expressed as the ratio of the Laplace transform of the output to the Laplace transform of the input.
G(s) = Y(s) / X(s)
Where:
G(s) - open loop transfer function
Y(s) - Laplace transform of the output
X(s) - Laplace transform of the input
Given Transfer Function
In this question, the given open loop transfer function is 1 - s / 1 + s.
Frequency Response of a System
To determine the gain of a system at a specific frequency, we substitute jω for s in the transfer function, where ω represents the angular frequency in radians per second.
G(jω) = Y(jω) / X(jω)
To find the gain at a specific frequency, we substitute ω = 1 rad/s in the transfer function and evaluate the expression.
Gain at Frequency ω = 1 rad/s
Substituting ω = 1 rad/s in the transfer function:
G(j1) = Y(j1) / X(j1)
Calculating the Gain
G(j1) = (1 - j) / (1 + j)
To calculate the gain, we need to find the modulus of this complex number.
|G(j1)| = sqrt((1 - j)^2) / sqrt((1 + j)^2)
Simplifying the expression:
|G(j1)| = sqrt(1^2 + (-1)^2) / sqrt(1^2 + 1^2)
|G(j1)| = sqrt(1 + 1) / sqrt(1 + 1)
|G(j1)| = sqrt(2) / sqrt(2)
|G(j1)| = 1
Hence, the gain of the system at a frequency of 1 rad/s is 1.
Conclusion
The correct answer is option 'A' - 1. The gain of the system at a frequency of 1 rad/s is 1.
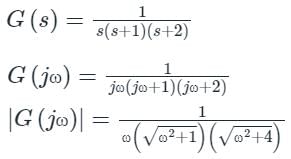
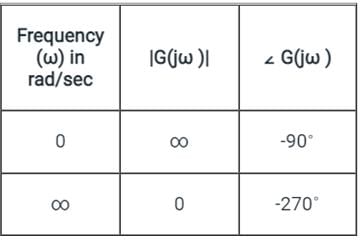
Consider the system represented by the equation given below. What would be the total phase value at ω = 0?
200/[s3 (s + 3) (s + 6) (s + 10)].- a)-90°
- b)-180°
- c)-270°
- d)-360°
Correct answer is option 'C'. Can you explain this answer?
Consider the system represented by the equation given below. What would be the total phase value at ω = 0?
200/[s3 (s + 3) (s + 6) (s + 10)].
200/[s3 (s + 3) (s + 6) (s + 10)].
a)
-90°
b)
-180°
c)
-270°
d)
-360°
|
|
Zoya Sharma answered |
The phase can be calculated by the basic formula for calculating phase angle.
Due to an addition of pole at origin, the polar plot gets shifted by ___ at ω = 0?- a)-45°
- b)-60°
- c)-90°
- d)-180°
Correct answer is option 'C'. Can you explain this answer?
Due to an addition of pole at origin, the polar plot gets shifted by ___ at ω = 0?
a)
-45°
b)
-60°
c)
-90°
d)
-180°
|
|
Ameya Nambiar answered |
Introduction
In control systems and signal processing, the addition of poles in the transfer function can significantly affect the behavior of the system. A pole at the origin alters the phase response of the system, especially at low frequencies.
Effect of a Pole at the Origin
- A pole at the origin contributes a phase lag of 90 degrees to the system's response.
- This means that for every pole added at the origin, the phase of the output signal will lag behind the input signal by 90 degrees.
Polar Plot Shift
- In a polar plot, the phase shift impacts the angle of the plot as a function of frequency (ω).
- At ω = 0, the introduction of a pole at the origin will shift the plot downwards by 90 degrees.
Conclusion
- Therefore, when a pole is added at the origin, the polar plot is effectively shifted by -90 degrees at ω = 0.
- This shift is crucial for understanding system stability and frequency response.
The correct answer is option C: -90°.
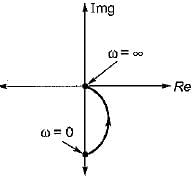
The open loop transfer function of a unity gain negative feedback system is given as
The Nyquist contour in the ��-plane encloses the entire right half plane and a small neighbourhood around the origin in the left half plane, as shown in the figure below. The number of encirclements of the point (−1 + j0) by the Nyquist plot of G(s), corresponding to the Nyquist contour, is denoted as N. Then N equals to
- a)0
- b)1
- c)2
- d)3
Correct answer is option 'B'. Can you explain this answer?
The open loop transfer function of a unity gain negative feedback system is given as
The Nyquist contour in the ��-plane encloses the entire right half plane and a small neighbourhood around the origin in the left half plane, as shown in the figure below. The number of encirclements of the point (−1 + j0) by the Nyquist plot of G(s), corresponding to the Nyquist contour, is denoted as N. Then N equals to
The Nyquist contour in the ��-plane encloses the entire right half plane and a small neighbourhood around the origin in the left half plane, as shown in the figure below. The number of encirclements of the point (−1 + j0) by the Nyquist plot of G(s), corresponding to the Nyquist contour, is denoted as N. Then N equals to
a)
0
b)
1
c)
2
d)
3
|
|
Zoya Sharma answered |
Concept
N = P - 2
N = no. of encirclements of )-1, 0) critical point by the Nyquist plot.
P = no. of right half of s-plane of G(s) H(s) as F(s)
z = no. of lright half of s-plane of CLTF as zero of F(s)
For stability z = 0
N - P = 0
N = P
for Nyquist stability criteria
Calculation
Open loop function:
Close loop transfer function =
Close loop transfer function =
no pole in right hand side
z = 0, P ⇒ 1
N = 1 - 0
N = 1
no. of oncirclements N = 1
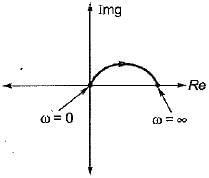
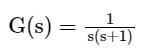
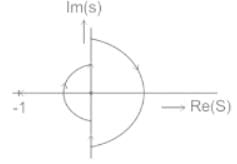
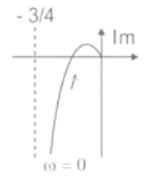
Polar plot of G(s) =  is a
is a- a)straight line
- b)semicircle
- c)parabola
- d)circle
Correct answer is option 'B'. Can you explain this answer?
Polar plot of G(s) = is a
is aa)
straight line
b)
semicircle
c)
parabola
d)
circle
|
|
Jyoti Basak answered |
Given, 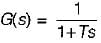
It is a type - 0 and order - 1 system, therefore its polar-plot will be as shown below.
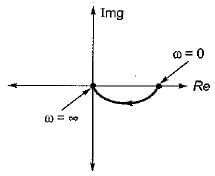
Hence, the polar plot will be semicircular in shape.
It is a type - 0 and order - 1 system, therefore its polar-plot will be as shown below.
Hence, the polar plot will be semicircular in shape.
The roots of the characteristic equation of the second order system in which real and imaginary part represents the :- a)Damped frequency and damping
- b)Damping and damped frequency
- c)Natural frequency and damping ratio
- d)Damping ratio and natural frequency
Correct answer is option 'B'. Can you explain this answer?
The roots of the characteristic equation of the second order system in which real and imaginary part represents the :
a)
Damped frequency and damping
b)
Damping and damped frequency
c)
Natural frequency and damping ratio
d)
Damping ratio and natural frequency
|
|
Hina Choudhary answered |
Understanding the Characteristic Equation
In control systems, the characteristic equation of a second-order system is crucial for analyzing system dynamics. The typical form of the characteristic equation is:
s² + 2ζω_ns + ω_n² = 0
where:
- s represents the complex roots,
- ζ is the damping ratio,
- ω_n is the natural frequency.
Roots of the Characteristic Equation
The roots of this equation can be expressed as:
s = -ζω_n ± jω_d
where:
- j represents the imaginary unit,
- ω_d is the damped frequency.
Real and Imaginary Parts
The roots consist of two components:
- The real part: -ζω_n (indicates the damping effect)
- The imaginary part: ± jω_d (indicates the oscillatory behavior)
Explanation of Option B
The correct identification of these components leads to understanding why option B is correct.
- Damping and Damped Frequency:
- The real part (-ζω_n) corresponds to the system’s damping. It determines how oscillations in the system decay over time.
- The imaginary part (± jω_d) corresponds to the damped frequency. It represents the frequency of oscillation when damping is present.
Conclusion
Thus, understanding the roots of the characteristic equation clarifies that the real part indicates the damping aspect while the imaginary part reflects the damped frequency, validating option B as the correct choice.
The polar plot of a transfer function passes through the critical point (-1,0). Gain margin is- a)Zero
- b)-1dB
- c)1dB
- d)Infinity
Correct answer is option 'A'. Can you explain this answer?
The polar plot of a transfer function passes through the critical point (-1,0). Gain margin is
a)
Zero
b)
-1dB
c)
1dB
d)
Infinity
|
|
Zoya Sharma answered |
Gain margin of a polar plot passing through the critical point is zero.
Which of the following is the correct comment on stability based on unknown k for the feedback system with characteristic s4 + 2ks3 + s2 + 5s + 5 = 0?- a)Unstable for all the values of k
- b)Stable for zero value of k
- c)Stable for positive value of k
- d)Stable for all the values of k
Correct answer is option 'A'. Can you explain this answer?
Which of the following is the correct comment on stability based on unknown k for the feedback system with characteristic s4 + 2ks3 + s2 + 5s + 5 = 0?
a)
Unstable for all the values of k
b)
Stable for zero value of k
c)
Stable for positive value of k
d)
Stable for all the values of k
|
|
Disha Das answered |
Explanation:
Characteristics of the given system:
- The characteristic equation of the system is s^4 + 2ks^3 + s^2 + 5s + 5 = 0.
Stability Analysis:
- The stability of a system is determined by the location of the roots of the characteristic equation in the complex plane.
- For a system to be stable, all the roots of the characteristic equation should have negative real parts.
Analysis of the given characteristic equation:
- By observing the given characteristic equation, we see that the coefficients are all positive.
- The system will have at least one root with a positive real part for any non-zero value of k.
Conclusion:
- Therefore, the system is unstable for all values of k.
- Option 'A' is the correct comment on stability based on unknown k for the feedback system with the given characteristic equation.
In Nyquist plot of a system on adding a pole at s = 0, then plot will -- a)remain unaltered
- b)rotate clockwise by 90°
- c)rotate anticlockwise by 90°
- d)rotate by 180°
Correct answer is option 'B'. Can you explain this answer?
In Nyquist plot of a system on adding a pole at s = 0, then plot will -
a)
remain unaltered
b)
rotate clockwise by 90°
c)
rotate anticlockwise by 90°
d)
rotate by 180°
|
|
Harshad Singh answered |
A) remain unaltered
Adding a pole at s = 0 in the Nyquist plot will not cause any rotation. The plot will remain unaltered because the pole at s = 0 does not contribute to the frequency response of the system.
Adding a pole at s = 0 in the Nyquist plot will not cause any rotation. The plot will remain unaltered because the pole at s = 0 does not contribute to the frequency response of the system.
The most important technique used for stability and the transient response of the system is- a)Nyquist plot
- b)Root locus
- c)Bode plot
- d)Routh Hurwitz criteria
Correct answer is option 'B'. Can you explain this answer?
The most important technique used for stability and the transient response of the system is
a)
Nyquist plot
b)
Root locus
c)
Bode plot
d)
Routh Hurwitz criteria
|
|
Ravi Singh answered |
Definition:
The root locus plots the poles of the closed-loop transfer function in the complex s-plane as K varies from 0 to ∞
The purpose of Root locus is defined as:
- To find the nature of the system and ‘K’ value for stability.
- To find the relative stability.
- If the root locus branches move towards the right, system is less stable and if they move towards the left then the system is more relative stable.
- It is the best method to find the Relative stability and RH criteria is best to find absolute stability
The relation between the closed-loop and open-loop poles
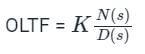
D(s) = 0 gives open-loop poles and N(s) = 0 gives closed-loop poles
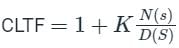
Characteristic equation is D(s) + kN(s) = 0.
Closed-loop poles are nothing but the sum of open-loop poles and zeroes.
Directions: It consists of two statements, one labelled as the ‘Statement (I)’ and the other as ‘Statement (II)’. Examine these two statements carefully and select the answers to these items using the codes given below:
Statement (I): The polar plot has limitation for portraying the frequency response of a system.
Statement (II): The calculation of frequency response is tedious and does not indicate the effect of the individual poles and zeros.- a)Both Statement (I) and Statement (II) are individually true and Statement (II) is the correct explanation of Statement (I)
- b)Both Statement (I) and Statement (II) are individually true but Statement (II) is not the correct explanation of Statement (I)
- c)Statement (I) is true but Statement (II) is false
- d)Statement (I) is false but Statement (II) is true
Correct answer is option 'D'. Can you explain this answer?
Directions: It consists of two statements, one labelled as the ‘Statement (I)’ and the other as ‘Statement (II)’. Examine these two statements carefully and select the answers to these items using the codes given below:
Statement (I): The polar plot has limitation for portraying the frequency response of a system.
Statement (II): The calculation of frequency response is tedious and does not indicate the effect of the individual poles and zeros.
Statement (I): The polar plot has limitation for portraying the frequency response of a system.
Statement (II): The calculation of frequency response is tedious and does not indicate the effect of the individual poles and zeros.
a)
Both Statement (I) and Statement (II) are individually true and Statement (II) is the correct explanation of Statement (I)
b)
Both Statement (I) and Statement (II) are individually true but Statement (II) is not the correct explanation of Statement (I)
c)
Statement (I) is true but Statement (II) is false
d)
Statement (I) is false but Statement (II) is true
|
|
Sanvi Kapoor answered |
Polar plot:
- The Polar plot is a plot, which can be drawn between the magnitude and the phase angle of G(jω)H(jω) by varying ω from zero to ∞.
- The calculation of frequency response is tedious, and it does not indicate the impact of individual components of open-loop transfer function.
- Another disadvantage of this plot is that it cannot tell how many poles are in right side of the complex plane.
- To overcome this disadvantage, magnitude is plotted by varying frequency from that is known as the Nyquist plot.
- It has no limitation in portraying the frequency response of a system.
Therefore, Statement (I) is false but Statement (II) is true.
Transfer function of a system is given as
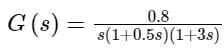
Polar plot of the same system is
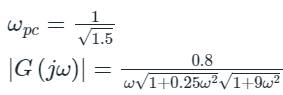
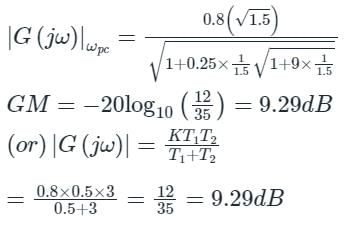
Gain margin (in dB) of the system is ______. (Important - Enter only the numerical value in the answer)
Correct answer is between '9,10'. Can you explain this answer?
Transfer function of a system is given as
Polar plot of the same system is
Gain margin (in dB) of the system is ______. (Important - Enter only the numerical value in the answer)
Polar plot of the same system is
Gain margin (in dB) of the system is ______. (Important - Enter only the numerical value in the answer)
|
|
Sanvi Kapoor answered |
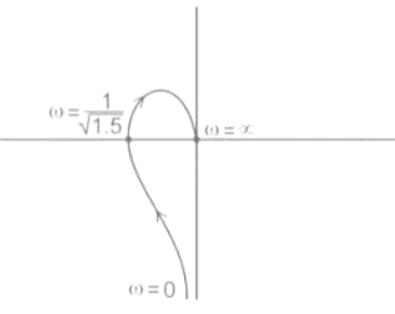
Gain margin (GM) and Phase margin (PM) from the polar plot:
Let us consider the polar plot as shown below,
Figure: A polar plot of a stable system
Gain margin (GM):
The frequency at which the polar plot crosses the negative real axis is called a phase cross-over frequency (ωpc).
Let 'a' be the point of intersection and it is the magnitude at the phase cross-over frequency.
⇒ a = | G(jωpc) H(jωpc) |
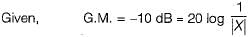
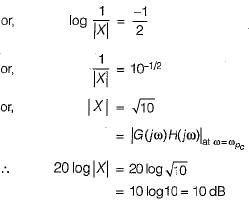
And, we know that
Gain margin (GM) = 1 / |G(jωpc) H(jωpc)| = 1 / a
Gain margin in dB = 20 log (1 / a)
Calculations:
In the Given polar plot;
Phase margin (PM):
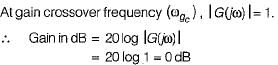
The frequency at which the polar plot crosses the unit circle (formed with the radius of the critical point) is called again cross-over frequency (ωgc).
From the polar plot, we can observe that
Phase margin (PM) = 180 - ∠G(jωgc) H(jωgc)
Let us consider the polar plot as shown below,
Figure: A polar plot of a stable system
Gain margin (GM):
The frequency at which the polar plot crosses the negative real axis is called a phase cross-over frequency (ωpc).
Let 'a' be the point of intersection and it is the magnitude at the phase cross-over frequency.
⇒ a = | G(jωpc) H(jωpc) |
And, we know that
Gain margin (GM) = 1 / |G(jωpc) H(jωpc)| = 1 / a
Gain margin in dB = 20 log (1 / a)
Calculations:
In the Given polar plot;
Phase margin (PM):
The frequency at which the polar plot crosses the unit circle (formed with the radius of the critical point) is called again cross-over frequency (ωgc).
From the polar plot, we can observe that
Phase margin (PM) = 180 - ∠G(jωgc) H(jωgc)
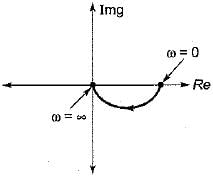
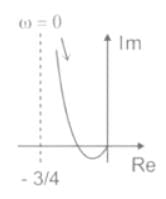
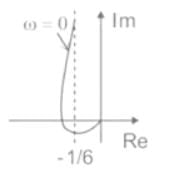
The frequency response of plotted in the complex G(jω) plane (for 0 < ω < ∞) is
- a)
- b)
- c)
- d)
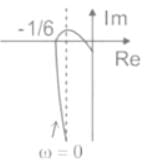
Correct answer is option 'D'. Can you explain this answer?
The frequency response ofplotted in the complex G(jω) plane (for 0 < ω < ∞) is
plotted in the complex G(jω) plane (for 0 < ω < ∞) isa)
b)
c)
d)
|
|
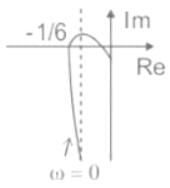
Cstoppers Instructors answered |
The given frequency response is

In Anti-clockwise the phase order is 0, 90, 180, 270, 360 or 0.
In clockwise the phase angle order is 0, -90, -180, -270, -360 or 0.
Here, 90∘ = -270∘ and 270∘ = -90∘
At ω = ωc (Cut-off frequency), ∠ G(jω) = -180∘
−90 − tan−1ωc − tan−10.5ωc = −180
tan−1ωc + tan−10.5ωc = 90
In clockwise the phase angle order is 0, -90, -180, -270, -360 or 0.
Here, 90∘ = -270∘ and 270∘ = -90∘
At ω = ωc (Cut-off frequency), ∠ G(jω) = -180∘
−90 − tan−1ωc − tan−10.5ωc = −180
tan−1ωc + tan−10.5ωc = 90

1 - 0.5ωc2 = 0
ωc = 1.414 rad/sec
At ω = ωc
|G(jω)| = (1/6)
The polar plot for given transfer function is
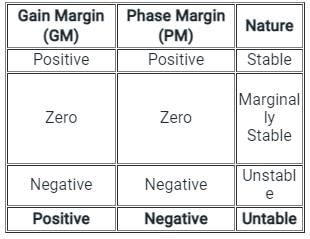
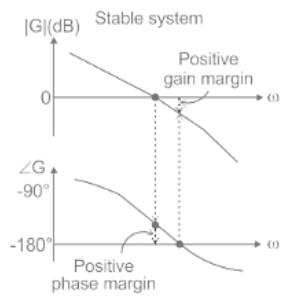
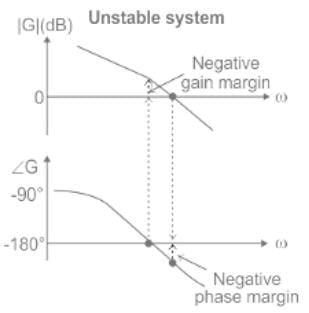
When the gain margin is positive and phase margin is negative, the system is:- a)unstable
- b)highly stable
- c)oscillatory
- d)stable
Correct answer is option 'A'. Can you explain this answer?
When the gain margin is positive and phase margin is negative, the system is:
a)
unstable
b)
highly stable
c)
oscillatory
d)
stable
|
|
Zoya Sharma answered |
Phase Cross over Frequency:
- The frequency at which the phase plot is having the phase of -180° is known as phase cross-over frequency.
- It is denoted ωpc .
- The unit of phase cross over frequency is rad/sec
Gain Cross over Frequency:
- The frequency at which the magnitude plot is having the magnitude of zero dB is known as gain cross over frequency.
- It is denoted by ωgc.
- The unit of gain cross over frequency is rad/sec
Gain Margin:
Gain margin GM is defined as the negative of the magnitude in dB, at phase cross over frequency, i.e.
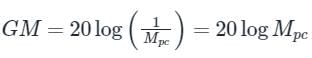
Mpc is the magnitude at phase cross over frequency. The unit of gain margin (GM) is dB.
Phase Margin
The phase margin of a system is defined as:
PM = 180° + ϕgc
The stability of the control system is based on the relation between gain margin and phase margin as:
Phase Margin
The phase margin of a system is defined as:
PM = 180° + ϕgc
The stability of the control system is based on the relation between gain margin and phase margin as:
Assertion (A): For a system to be stable, the roots of the characteristic equation should not lie in the right half of the s-plane or on the imaginary axis.
Reason (R): A system is said to be stable if the zeros of the closed loop transfer function are all in the left half of s-plane.- a)Both A and R are true and R is a correct explanation of A.
- b)Both A and R are true but R is not a correct explanation of A.
- c)A is true but R is false.
- d)A is false but R is true.
Correct answer is option 'C'. Can you explain this answer?
Assertion (A): For a system to be stable, the roots of the characteristic equation should not lie in the right half of the s-plane or on the imaginary axis.
Reason (R): A system is said to be stable if the zeros of the closed loop transfer function are all in the left half of s-plane.
Reason (R): A system is said to be stable if the zeros of the closed loop transfer function are all in the left half of s-plane.
a)
Both A and R are true and R is a correct explanation of A.
b)
Both A and R are true but R is not a correct explanation of A.
c)
A is true but R is false.
d)
A is false but R is true.
|
|
Rajat Kumar answered |
Poles of the closed loop transfer function is the characteristic equation of a closed loop control system. For the system to be stable all roots of characteristic equation should lie in LH s-plane. Hence reason is false.
A system with a unity gain margin and zero phase margin is _____- a)sluggish
- b)highly stable
- c)oscillatory
- d)relatively stable
Correct answer is option 'C'. Can you explain this answer?
A system with a unity gain margin and zero phase margin is _____
a)
sluggish
b)
highly stable
c)
oscillatory
d)
relatively stable
|
|
Rajat Kapoor answered |
Unity Gain Margin (UGM) and Phase Margin (PM) are two important parameters used to analyze the stability of a control system.
Unity Gain Margin refers to the amount of gain that can be added to the system before it becomes unstable, while Phase Margin refers to the amount of phase lag that can be added to the system before it becomes unstable.
In this case, the system has a unity gain margin, which means that the system is on the verge of instability. This implies that any further increase in gain will cause the system to become unstable.
Zero Phase Margin means that the system has no phase lag before it becomes unstable. A zero phase margin indicates that the system is oscillatory in nature, meaning it will exhibit sustained oscillations or ringing behavior.
Hence, the correct answer is option C - oscillatory.
Here is a detailed explanation of each option:
a) Sluggish: Sluggishness refers to a slow response. A unity gain margin and zero phase margin do not imply sluggishness.
b) Highly stable: A highly stable system would have a large gain margin and a large phase margin. A unity gain margin and zero phase margin indicate that the system is on the verge of instability, so it is not highly stable.
c) Oscillatory: As mentioned earlier, a zero phase margin indicates that the system is oscillatory in nature. It will exhibit sustained oscillations or ringing behavior. Hence, this option is correct.
d) Relatively stable: Relatively stable refers to a system that is stable but with a small margin of stability. A unity gain margin and zero phase margin indicate that the system is on the verge of instability, so it is not relatively stable.
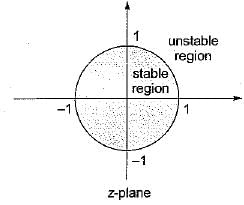
For a discrete-time system to be unstable, all the poles of the z-transfer function should lie- a)on the left-half of z-plane
- b)on the right-half of z-plane
- c)outside the circle of unit radius
- d)within a circle of unit radius
Correct answer is option 'C'. Can you explain this answer?
For a discrete-time system to be unstable, all the poles of the z-transfer function should lie
a)
on the left-half of z-plane
b)
on the right-half of z-plane
c)
outside the circle of unit radius
d)
within a circle of unit radius
|
|
Mihir Chawla answered |
In a bode magnitude plot, which one of the following slopes would be exhibited at high frequencies by a 4th order all-pole system?- a)-80dB/decade
- b)-40 dB/decade
- c)40 dB/decade
- d)80 dB/decade
Correct answer is option 'A'. Can you explain this answer?
In a bode magnitude plot, which one of the following slopes would be exhibited at high frequencies by a 4th order all-pole system?
a)
-80dB/decade
b)
-40 dB/decade
c)
40 dB/decade
d)
80 dB/decade
|
|
Naina Agarwal answered |
Understanding the Bode Magnitude Plot for a 4th Order All-Pole System
In control theory and signal processing, the Bode magnitude plot is a graphical representation of a system's frequency response. For a 4th order all-pole system, the behavior at high frequencies is particularly significant.
Characteristics of All-Pole Systems
- An all-pole system consists solely of poles and no zeros.
- The system is defined by its transfer function, which influences its stability and frequency response.
High-Frequency Response
- At high frequencies, each pole contributes to the slope of the Bode magnitude plot.
- For a first-order pole, the slope is -20 dB/decade.
Calculating the Total Slope
- A 4th order all-pole system has four poles.
- Therefore, the total slope at high frequencies is calculated as follows:
- Total slope = Number of poles x Slope per pole
- Total slope = 4 poles x (-20 dB/decade) = -80 dB/decade
Conclusion
- The high-frequency behavior of a 4th order all-pole system results in a slope of -80 dB/decade in the Bode magnitude plot.
- This negative slope indicates that as frequency increases, the gain of the system decreases significantly, reflecting the filtering characteristics of the system.
Thus, the correct answer is option 'A': -80 dB/decade.
The slope of the line due to  factor in magnitude part of Bode plot is
- a)-40 db per octave
- b)-20 db per octave
- c)-12 db per octave
- d)-4 db per octave
Correct answer is option 'C'. Can you explain this answer?
The slope of the line due to factor in magnitude part of Bode plot is
factor in magnitude part of Bode plot isa)
-40 db per octave
b)
-20 db per octave
c)
-12 db per octave
d)
-4 db per octave
|
|
Swati Shah answered |
 represents type-2 factor which will have a slope of -40 db/decade.
We know that,
-20 db/decase = - 6 db/octave
∴ -40 db/decase = -12 db/octave
Assertion (A): A system is said to be stable if the impulse response approaches zero for sufficiently large time.
Reason (R): If the impulse response approaches infinity for sufficiently large time, the system is said to be unstable- a)Both A and R are true and R is a correct explanation of A.
- b)Both A and R are true but R is not a correct explanation of A.
- c)A is true but R is false.
- d)A is false but R is true.
Correct answer is option 'B'. Can you explain this answer?
Assertion (A): A system is said to be stable if the impulse response approaches zero for sufficiently large time.
Reason (R): If the impulse response approaches infinity for sufficiently large time, the system is said to be unstable
Reason (R): If the impulse response approaches infinity for sufficiently large time, the system is said to be unstable
a)
Both A and R are true and R is a correct explanation of A.
b)
Both A and R are true but R is not a correct explanation of A.
c)
A is true but R is false.
d)
A is false but R is true.
|
|
Sravya Bajaj answered |
Both assertion and reason are individually true. The correct reason for assertion is BIBO stability criteria,
The characteristic equation of a closed loop control system is given by s2 + 4s + 16 = 0. The resonant frequency (in radian/sec) of the system is- a)2
- b)2√3
- c)4
- d)2√2
Correct answer is option 'D'. Can you explain this answer?
The characteristic equation of a closed loop control system is given by s2 + 4s + 16 = 0. The resonant frequency (in radian/sec) of the system is
a)
2
b)
2√3
c)
4
d)
2√2
|
|
Sharmila Kulkarni answered |
Given, s2 + 4s+ 16 = 0
or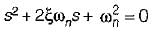
∴ ωn = 4 rad/s
and
∴ Resonant frequency,
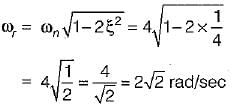
or
∴ ωn = 4 rad/s
and
∴ Resonant frequency,
Bode plot is applicable for - - a)Minimum phase network
- b)Non-minimum phase network
- c)All pass network
- d)Every network of the control system
Correct answer is option 'A'. Can you explain this answer?
Bode plot is applicable for -
a)
Minimum phase network
b)
Non-minimum phase network
c)
All pass network
d)
Every network of the control system
|
|
Sanya Agarwal answered |
Bode plot:
- In electrical engineering and control theory, a Bode plot is a graph of the frequency response of a system. It is usually a combination of a Bode magnitude plot, expressing the magnitude (usually in decibels) of the frequency response, and a Bode phase plot, expressing the phase shift.
- The Bode magnitude plot is the graph of the function |H(s = jω)| of frequency ω (with j being the imaginary unit). The ω -axis of the magnitude plot is logarithmic and the magnitude is given in decibels, i.e., a value for the magnitude |H| is plotted on the axis at 20log10|H|
- The Bode phase plot is the graph of the phase, commonly expressed in degrees, of the transfer function H(s = jω ) as a function of ω . The phase is plotted on the same logarithmic ω-axis as the magnitude plot, but the value for the phase is plotted on a linear vertical axis.
- For many practical problems, the detailed Bode plots can be approximated with straight-line segments that are asymptotes of the precise response. Hence Bode plot as asymptotic plot.
- Bode plot is applicable for minimum phase system.
Minimum Phase system:
- A transfer function G(s) is minimum phase if both G(s) and 1/G(s) are causal and stable
- A minimum phase system does not have zeros or poles on the right-half plane and it does not have delay.
- Bode discovered that the phase can be uniquely derived from the slope of the magnitude for minimum-phase system.
- We can draw Bode plot for non-minimum phase systems, but the magnitude and phase-angle plots are not 'uniquely related'.
- For a Minimum phase system, the magnitude and phase-angle plots are uniquely related, that means if either one of them is specified over the entire frequency range, the other plot can be determined uniquely. This does not apply to NMP systems.
Assertion (A): If the system is stable we can determine the relative stability by the settling time of the system.
Reason (R): If the settling time is less than that of the other system then the system is said to be relatively more stable.- a)Both A and R are true and R is a correct explanation of A.
- b)Both A and R are true but R is not a correct explanation of A.
- c)A is true but R is false.
- d)A is false but R is true.
Correct answer is option 'A'. Can you explain this answer?
Assertion (A): If the system is stable we can determine the relative stability by the settling time of the system.
Reason (R): If the settling time is less than that of the other system then the system is said to be relatively more stable.
Reason (R): If the settling time is less than that of the other system then the system is said to be relatively more stable.
a)
Both A and R are true and R is a correct explanation of A.
b)
Both A and R are true but R is not a correct explanation of A.
c)
A is true but R is false.
d)
A is false but R is true.
|
|
Shalini Banerjee answered |
The settling time is inversely proportional to the real part of the dominant roots. If the settling time is less compared to other system, then the system will be relatively more stable
Chapter doubts & questions for Nyquist's Criterion - Electrical Engineering Optional Notes for UPSC 2025 is part of UPSC CSE exam preparation. The chapters have been prepared according to the UPSC CSE exam syllabus. The Chapter doubts & questions, notes, tests & MCQs are made for UPSC CSE 2025 Exam. Find important definitions, questions, notes, meanings, examples, exercises, MCQs and online tests here.
Chapter doubts & questions of Nyquist's Criterion - Electrical Engineering Optional Notes for UPSC in English & Hindi are available as part of UPSC CSE exam.
Download more important topics, notes, lectures and mock test series for UPSC CSE Exam by signing up for free.
Electrical Engineering Optional Notes for UPSC
550 videos|588 docs|343 tests
|
|
© EduRev
|
Education Revolution
|


|


Signup on EduRev and stay on top of your study goals
10M+ students crushing their study goals daily