


SSC Exam > SSC Questions > Stringing chart represents a graph of-a)Tens...
Start Learning for Free
Stringing chart represents a graph of-
- a)Tension - Temperature
- b)Sag - Temperature
- c)Load - Temperature
- d)Both A and B
Correct answer is option 'D'. Can you explain this answer?

Most Upvoted Answer
Stringing chart represents a graph of-a)Tension - Temperatureb)Sag - ...
Stringing chart is basically a graph between Sag, Tension with Temperature. As we want low Tension and minimum sag in our conductor but that is not possible as sag is inversely proportional to tension. It is because low sag means a tight wire and high tension whereas a low tension means a loose wire and increased sag. Therefore, we make a compromise between two but if the case of temperature is considered and we draw a graph then that graph is called a Stringing chart.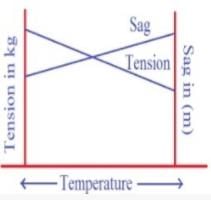
As Temperature increases then sag will increase but sag is inversely proportional to Tension so Tension will decrease.
Hence, the correct option is (D)
Free Test
FREE
| Start Free Test |
Community Answer
Stringing chart represents a graph of-a)Tension - Temperatureb)Sag - ...
Stringing Chart Graph
The Stringing chart represents a graph of tension sag vs temperature, which is used in the electrical industry to determine the sag of overhead conductors. It is also known as a tension-temperature chart.
Tension vs Temperature
The graph shows the relationship between the tension and temperature of the conductor. The tension in the conductor varies with temperature due to the thermal expansion of the conductor. As the temperature increases, the conductor expands, which results in a decrease in tension. Hence, the graph shows a negative slope.
Sag vs Temperature
The sag of the conductor is the amount of droop in the conductor at a given temperature. The sag of the conductor is affected by the tension and temperature of the conductor. As the tension decreases, the sag of the conductor increases. Hence, the graph shows a positive slope.
Load vs Temperature
The load on the conductor also affects the sag of the conductor. As the load increases, the sag of the conductor increases. Hence, the graph shows an increasing trend with load.
Conclusion
The Stringing chart is a useful tool for determining the sag of overhead conductors. It helps in determining the tension in the conductor at a given temperature and load, which is essential for the safe and efficient operation of the electrical system.

|
Explore Courses for SSC exam
|
|
Top Courses for SSCView all


Question Description
Stringing chart represents a graph of-a)Tension - Temperatureb)Sag - Temperaturec)Load - Temperatured)Both A and BCorrect answer is option 'D'. Can you explain this answer? for SSC 2025 is part of SSC preparation. The Question and answers have been prepared according to the SSC exam syllabus. Information about Stringing chart represents a graph of-a)Tension - Temperatureb)Sag - Temperaturec)Load - Temperatured)Both A and BCorrect answer is option 'D'. Can you explain this answer? covers all topics & solutions for SSC 2025 Exam. Find important definitions, questions, meanings, examples, exercises and tests below for Stringing chart represents a graph of-a)Tension - Temperatureb)Sag - Temperaturec)Load - Temperatured)Both A and BCorrect answer is option 'D'. Can you explain this answer?.
Stringing chart represents a graph of-a)Tension - Temperatureb)Sag - Temperaturec)Load - Temperatured)Both A and BCorrect answer is option 'D'. Can you explain this answer? for SSC 2025 is part of SSC preparation. The Question and answers have been prepared according to the SSC exam syllabus. Information about Stringing chart represents a graph of-a)Tension - Temperatureb)Sag - Temperaturec)Load - Temperatured)Both A and BCorrect answer is option 'D'. Can you explain this answer? covers all topics & solutions for SSC 2025 Exam. Find important definitions, questions, meanings, examples, exercises and tests below for Stringing chart represents a graph of-a)Tension - Temperatureb)Sag - Temperaturec)Load - Temperatured)Both A and BCorrect answer is option 'D'. Can you explain this answer?.
Solutions for Stringing chart represents a graph of-a)Tension - Temperatureb)Sag - Temperaturec)Load - Temperatured)Both A and BCorrect answer is option 'D'. Can you explain this answer? in English & in Hindi are available as part of our courses for SSC.
Download more important topics, notes, lectures and mock test series for SSC Exam by signing up for free.
Here you can find the meaning of Stringing chart represents a graph of-a)Tension - Temperatureb)Sag - Temperaturec)Load - Temperatured)Both A and BCorrect answer is option 'D'. Can you explain this answer? defined & explained in the simplest way possible. Besides giving the explanation of
Stringing chart represents a graph of-a)Tension - Temperatureb)Sag - Temperaturec)Load - Temperatured)Both A and BCorrect answer is option 'D'. Can you explain this answer?, a detailed solution for Stringing chart represents a graph of-a)Tension - Temperatureb)Sag - Temperaturec)Load - Temperatured)Both A and BCorrect answer is option 'D'. Can you explain this answer? has been provided alongside types of Stringing chart represents a graph of-a)Tension - Temperatureb)Sag - Temperaturec)Load - Temperatured)Both A and BCorrect answer is option 'D'. Can you explain this answer? theory, EduRev gives you an
ample number of questions to practice Stringing chart represents a graph of-a)Tension - Temperatureb)Sag - Temperaturec)Load - Temperatured)Both A and BCorrect answer is option 'D'. Can you explain this answer? tests, examples and also practice SSC tests.
|
|
Explore Courses for SSC exam
|
|

Signup for Free!
Signup to see your scores go up within 7 days! Learn & Practice with 1000+ FREE Notes, Videos & Tests.


|
© EduRev
|
Education Revolution
|


|


Signup to see your scores
go up within 7 days!
Access 1000+ FREE Docs, Videos and Tests
Takes less than 10 seconds to signup