


All questions of Probability and Statistics for Electronics and Communication Engineering (ECE) Exam
A fair coin is tossed 10 times. What is the probability that ONLY the first two tosses will yield heads? - a)

- b)

- c)

- d)
Correct answer is option 'C'. Can you explain this answer?
A fair coin is tossed 10 times. What is the probability that ONLY the first two tosses will yield heads?
a)
b)
c)
d)
|
|
Rhea Reddy answered |
Let A be the event that first toss is head
And B be the event that second toss is head.
By the given condition rest all 8 tosses should be tail
∴ The probability of getting head in first two cases

A fair dice is rolled twice. The probability that an odd number will follow an even number is - a)1/2
- b)1/6
- c)1/3
- d)1/4
Correct answer is option 'D'. Can you explain this answer?
A fair dice is rolled twice. The probability that an odd number will follow an even number is
a)
1/2
b)
1/6
c)
1/3
d)
1/4

|
Raghavendra Sharma answered |
Probability of even number =3/6 =1/2
Probability of odd number =3/6 =1/2
Both are independent so probability=1/2.1/2 =1/4
An examination consists of two papers, Paper 1 and Paper 2. The probability of failing in Paper 1 is 0.3 and that in Paper 2 is 0.2. Given that a student has failed in Paper 2, the probability of failing in Paper 1 is 0.6. The probability of a student failing in both the papers is- a)0.5
- b)0.18
- c) 0.12
- d) 0.06
Correct answer is option 'C'. Can you explain this answer?
An examination consists of two papers, Paper 1 and Paper 2. The probability of failing in Paper 1 is 0.3 and that in Paper 2 is 0.2. Given that a student has failed in Paper 2, the probability of failing in Paper 1 is 0.6. The probability of a student failing in both the papers is
a)
0.5
b)
0.18
c)
0.12
d)
0.06
|
|
Akshita Choudhury answered |
Understanding the Problem
To find the probability of a student failing both papers, we will use the information given about the probabilities of failing each paper and their conditional probabilities.
Given Probabilities
- Probability of failing Paper 1 (P(F1)) = 0.3
- Probability of failing Paper 2 (P(F2)) = 0.2
- Conditional probability of failing Paper 1 given failing Paper 2 (P(F1 | F2)) = 0.6
Using the Conditional Probability Formula
To find the probability of failing both papers (P(F1 ∩ F2)), we can use the formula:
P(F1 ∩ F2) = P(F2) * P(F1 | F2)
Calculating the Probability
1. Find P(F1 ∩ F2):
- Substitute the known values into the formula:
- P(F1 ∩ F2) = P(F2) * P(F1 | F2)
- P(F1 ∩ F2) = 0.2 * 0.6
2. Calculate:
- P(F1 ∩ F2) = 0.12
Conclusion
Thus, the probability of a student failing both Paper 1 and Paper 2 is 0.12.
The correct answer is option 'C'.
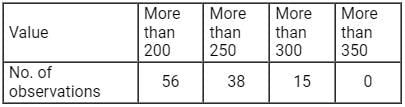
Find the no. of observations between 250 and 300 from the following data:
- a)56
- b)23
- c)15
- d)8
Correct answer is option 'B'. Can you explain this answer?
Find the no. of observations between 250 and 300 from the following data:
a)
56
b)
23
c)
15
d)
8

|
Engineers Adda answered |
Concept:
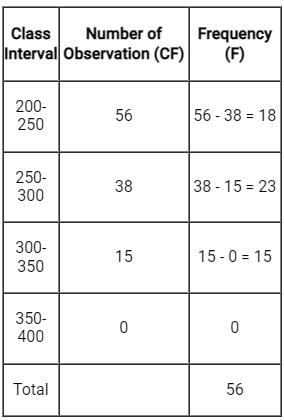
To find number of observations between 250 and 300.
first we have to draw a frequency distribution table from this data.
first we have to draw a frequency distribution table from this data.
∴ The Number of observation in between 250-300 = 38 - 15 = 23.
A box contains 2 washers, 3 nuts and 4 bolts. Items are drawn from the box at random one at a time without replacement. The probability of drawing 2 washers first followed by 3 nuts and subsequently the 4 bolts is- a)2/315
- b)1/630
- c)1/1260
- d)1/2520
Correct answer is option 'C'. Can you explain this answer?
A box contains 2 washers, 3 nuts and 4 bolts. Items are drawn from the box at random one at a time without replacement. The probability of drawing 2 washers first followed by 3 nuts and subsequently the 4 bolts is
a)
2/315
b)
1/630
c)
1/1260
d)
1/2520
|
|
Jaideep Dasgupta answered |
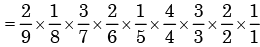
Here sample space = 9
The required probability of drawing 2 washers, 3 nuts and 4 bolts respectively without replac ement

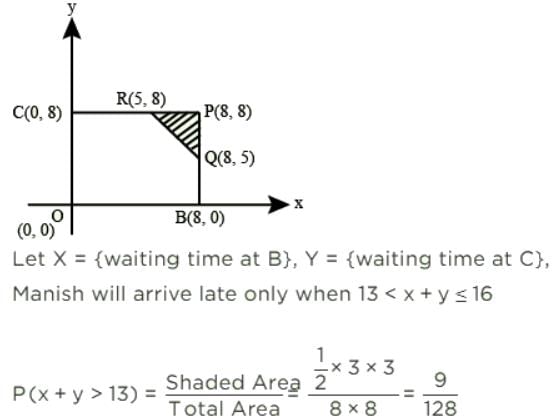
Manish has to travel from A to D changing buses at stops B and C enroute. The maximum waiting time at either stop can be 8 minutes each, but any time of waiting up to 8 minutes is equally likely at both places. He can afford up to 13 minutes of total waiting time if he is to arrive at D on time. What is the probability that Manish will arrive late at D?
- a)9/128
- b)13/64
- c)119/128
- d)8/13
Correct answer is option 'A'. Can you explain this answer?
Manish has to travel from A to D changing buses at stops B and C enroute. The maximum waiting time at either stop can be 8 minutes each, but any time of waiting up to 8 minutes is equally likely at both places. He can afford up to 13 minutes of total waiting time if he is to arrive at D on time. What is the probability that Manish will arrive late at D?
a)
9/128
b)
13/64
c)
119/128
d)
8/13

|
Machine Experts answered |
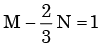
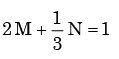
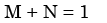
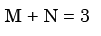
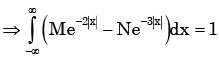
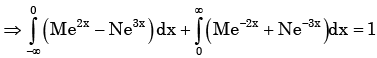
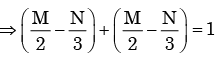
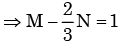
Px(x) = M exp(–2|x|) – N exp(–3 |x|) is the probability density function for the real random variable X, over the entire x axis. M and N are both positive real numbers. The equation relating M and N is - a)
- b)
- c)
- d)
Correct answer is option 'A'. Can you explain this answer?
Px(x) = M exp(–2|x|) – N exp(–3 |x|) is the probability density function for the real random variable X, over the entire x axis. M and N are both positive real numbers. The equation relating M and N is
a)
b)
c)
d)

|
Pathways Academy answered |
Given Px (x ) is the probability density function for the random variable X.
If a variable takes discrete values a + 4, a - 3.5, a - 2.5, a - 3, a - 2, a + 0.5, a + 5 and a - 0.5 where a > 0, then the median of the data set is- a)a - 2.5
- b)a - 1.25
- c)a - 1.5
- d)a - o.75
Correct answer is option 'B'. Can you explain this answer?
If a variable takes discrete values a + 4, a - 3.5, a - 2.5, a - 3, a - 2, a + 0.5, a + 5 and a - 0.5 where a > 0, then the median of the data set is
a)
a - 2.5
b)
a - 1.25
c)
a - 1.5
d)
a - o.75
|
|
Engineers Adda answered |
Given:
The given values = a + 4, a – 3.5, a – 2.5, a – 3, a – 2, a + 0.5, a + 5 and a – 0.5
The given values = a + 4, a – 3.5, a – 2.5, a – 3, a – 2, a + 0.5, a + 5 and a – 0.5
Concept used:
If n is odd
Median = [(n + 1)/2]th observations
If n is even
Median = [(n/2)th + (n/2 + 1)th observations]/2
Calculation:
a + 4, a – 3.5, a – 2.5, a – 3, a – 2, a + 0.5, a + 5 and a – 0.5
Arrange the data in ascending order
⇒ a – 3.5, a – 3, a – 2.5, a – 2, a – 0.5, a + 0.5, a + 4, a + 5
Here, the n is 8, which is even
Median = [(n/2)th + (n/2 + 1)th observations]/2
⇒ [(8/2) + (8/2 + 1)/2] term
⇒ 4th + 5th term
⇒ [(a – 2 + a – 0.5)/2]
⇒ [(2a – 2.5)/2]
⇒ a – 1.25
∴ The median of the data set is a – 1.25
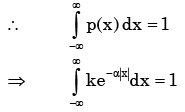
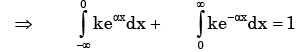
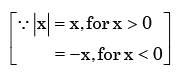
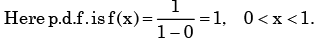
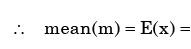
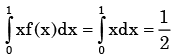
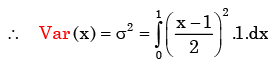
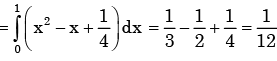
A probability density function is of the form 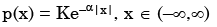 The value of K is
 - a)0.5
- b)1
- c)0.5α
- d)α
Correct answer is option 'C'. Can you explain this answer?
A probability density function is of the form
The value of K is
a)
0.5
b)
1
c)
0.5α
d)
α
|
|
Ravi Singh answered |
As (x) is a probability density function
A box contains 20 defective items and 80 non-defective items. If two items are selected at random without replacement, what will be the probability that both items are defective? - a)1/5
- b)1/25
- c)20/99
- d)11/495
Correct answer is option 'D'. Can you explain this answer?
A box contains 20 defective items and 80 non-defective items. If two items are selected at random without replacement, what will be the probability that both items are defective?
a)
1/5
b)
1/25
c)
20/99
d)
11/495

|
Kaavya Sengupta answered |
Total number of items = 100
Number of defective items = 20
Number of Non-defective items = 80
Then the probability that both items are defective, when 2 items are selected at random is,
⇒ P= (20C2x80C0)/(100C2) = 19/495
Can you explain the answer of this question below:Let X and Y be two independent random variables. Which one of the relations between expectation (E), variance (Var) and covariance (Cov) given below is FALSE?
- A:
E (XY) = E (X) E (Y)
- B:
Cov (X, Y) = 0
- C:
Var (X + Y) = Var (X) + Var (Y)
- D:
E (X2 y2) = (E (X))2 (E (y))2
The answer is b.
Let X and Y be two independent random variables. Which one of the relations between expectation (E), variance (Var) and covariance (Cov) given below is FALSE?
E (XY) = E (X) E (Y)
Cov (X, Y) = 0
Var (X + Y) = Var (X) + Var (Y)
E (X2 y2) = (E (X))2 (E (y))2

|
Anirudh Kulkarni answered |
Chebyshev is a mathematical term that refers to the Chebyshev inequality or the Chebyshev's theorem. It is a statistical concept that provides an upper bound for the probability of a random variable deviating from its mean by more than a certain number of standard deviations.
The Chebyshev's inequality states that for any random variable with a finite mean and variance, the probability that the random variable deviates from its mean by more than k standard deviations is less than or equal to 1/k^2, where k is any positive number greater than 1.
In other words, Chebyshev's inequality provides a general bound on the probability of extreme events occurring, regardless of the shape of the probability distribution. It is widely used in probability theory and statistics to estimate the likelihood of rare events or outliers.
The Chebyshev inequality is a useful tool in statistical analysis and can be applied to various fields including finance, physics, and engineering. It allows for the estimation of probabilities without assuming any specific distribution, which makes it a versatile and practical tool in many applications.
Can you explain the answer of this question below:Three companies X, Y and Z supply computers to a university. The percentage of computers supplied by them and the probability of those being defective are tabulated below
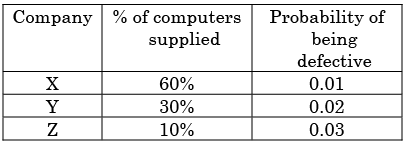
Given that a computer is defective, the probability that it was supplied by Y is
- A:
0. 1
- B:
0.2
- C:
0.3
- D:
0.4
The answer is d.
Three companies X, Y and Z supply computers to a university. The percentage of computers supplied by them and the probability of those being defective are tabulated below
Given that a computer is defective, the probability that it was supplied by Y is
0. 1
0.2
0.3
0.4
|
|
Kabir Verma answered |
Probability of defective computer supplied by Y =
(Case when Y produces defective)/(All cases of producing defective product)
Case when Y produces defective = (0.3)(0.02) = 0.006
All cases of producing defective product= (0.6x0.01)+(0.3x0.02)
(0.1x0.03)= 0.006+0.006+0.003=0.015
(Case when Y produces defective)/(All cases of producing defective product)
Case when Y produces defective = (0.3)(0.02) = 0.006
All cases of producing defective product= (0.6x0.01)+(0.3x0.02)
(0.1x0.03)= 0.006+0.006+0.003=0.015
Probability = 0.006/0.015=0.4
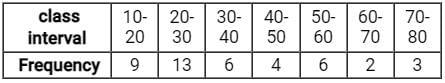
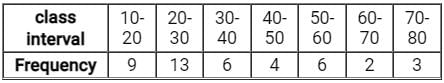
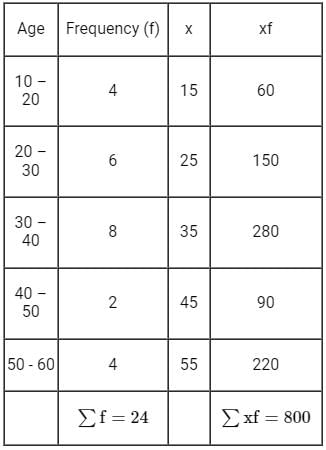
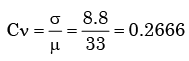
Find the mean of given data:
- a)39.95
- b)35.70
- c)43.95
- d)23.95
Correct answer is option 'B'. Can you explain this answer?
Find the mean of given data:
a)
39.95
b)
35.70
c)
43.95
d)
23.95
|
|
Engineers Adda answered |
Formula used:
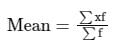
The mean of grouped data is given by,
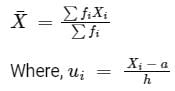
Xi = mean of ith class
fi = frequency corresponding to ith class
Given:
fi = frequency corresponding to ith class
Given:
Calculation:
Now, to calculate the mean of data will have to find ∑fiXi and ∑fi as below,
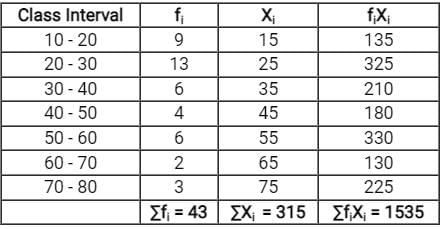
Now, to calculate the mean of data will have to find ∑fiXi and ∑fi as below,
Then,
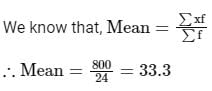
We know that, mean of grouped data is given by
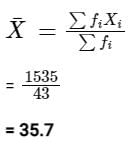
We know that, mean of grouped data is given by
Hence, the mean of the grouped data is 35.7
The mean of 25 observations is 36 . If the mean of the first 13 observations is 32 and that of the last 13 observations is 39 , the 13th observation is: - a)22
- b)25
- c)26
- d)23
Correct answer is option 'D'. Can you explain this answer?
The mean of 25 observations is 36 . If the mean of the first 13 observations is 32 and that of the last 13 observations is 39 , the 13th observation is:
a)
22
b)
25
c)
26
d)
23
|
|
Sanya Agarwal answered |
Given:
The mean of 25 observations is 36
The mean of the first 13 observations is 32 and that of the last 13 observations is 39
The mean of 25 observations is 36
The mean of the first 13 observations is 32 and that of the last 13 observations is 39
Concept used:
Mean = sum of all observation/total number of observation
Mean = sum of all observation/total number of observation
Calculation:
The sum of all 25 observation = 25 × 36 = 900
Sum of first 13 observations = 13 × 32 = 416
Sum of last 13 observations = 13 × 39 = 507
∴ 13th term = (416 + 507) - 900 = 923 - 900 = 23
The sum of all 25 observation = 25 × 36 = 900
Sum of first 13 observations = 13 × 32 = 416
Sum of last 13 observations = 13 × 39 = 507
∴ 13th term = (416 + 507) - 900 = 923 - 900 = 23
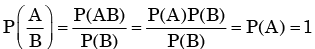
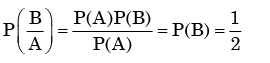
Let P(E) denote the probability of the even E. Given 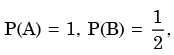 the values of
 respectively are
 - a)

- b)

- c)

- d)

Correct answer is option 'D'. Can you explain this answer?
Let P(E) denote the probability of the even E. Given the values of respectively are
the values of respectively are a)
b)
c)
d)

|
Bhaskar Unni answered |
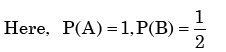
We need to find the conditional probability of two given events without being told about P(AB). Also it is not mentioned that they are independent events. But since P(A)=1, it means that A covers the complete sample.
So, P(AB)=P(B)=1/2

In Regression Analysis, if a quantitative variable has 'm' categories, one can introduce- a)Only m + 1 dummy variables
- b)Only m -1 dummy variables
- c)Only m dummy variables
- d)Only 2 m variables
Correct answer is option 'B'. Can you explain this answer?
In Regression Analysis, if a quantitative variable has 'm' categories, one can introduce
a)
Only m + 1 dummy variables
b)
Only m -1 dummy variables
c)
Only m dummy variables
d)
Only 2 m variables

|
Nabanita Saha answered |
Introduction:
Regression analysis is a statistical technique used to model the relationship between a dependent variable and one or more independent variables. In regression analysis, when we have a quantitative variable with m categories, we need to introduce dummy variables to represent these categories in the regression model.
Explanation:
To introduce dummy variables for a quantitative variable with m categories, we need to follow certain rules:
1. Number of Dummy Variables:
We need to introduce m - 1 dummy variables for a quantitative variable with m categories. The reason behind this is the concept of "dummy variable trap" or "multicollinearity".
2. Dummy Variable Trap:
The dummy variable trap occurs when we include a dummy variable for each category of a qualitative variable in the regression model. Including a dummy variable for each category can lead to perfect multicollinearity, where the independent variables are highly correlated. This can result in an unstable regression model with unreliable coefficient estimates.
3. Multicollinearity:
Multicollinearity refers to the situation where two or more independent variables in a regression model are highly correlated with each other. In the case of introducing a dummy variable for each category, one category becomes the reference or baseline category, and the remaining m - 1 categories are represented by dummy variables. As a result, the dummy variables are perfectly correlated with each other, leading to multicollinearity.
4. Baseline Category:
By introducing m - 1 dummy variables, we implicitly define one category as the baseline or reference category. The baseline category is the category for which the coefficients of dummy variables are compared and interpreted. The coefficients of the dummy variables represent the difference in the mean value of the dependent variable between each category and the baseline category.
Conclusion:
In regression analysis, when a quantitative variable has m categories, we introduce m - 1 dummy variables to avoid the dummy variable trap and multicollinearity. By doing so, we can accurately model the relationship between the dependent variable and the quantitative variable with multiple categories.
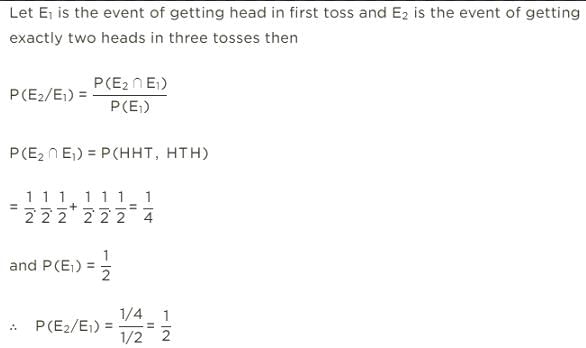
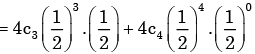
An unbiased coin is tossed three times. The probability that the head turns up in exactly two cases is - a)1/9
- b)1/8
- c)2/3
- d)3/8
Correct answer is option 'D'. Can you explain this answer?
An unbiased coin is tossed three times. The probability that the head turns up in exactly two cases is
a)
1/9
b)
1/8
c)
2/3
d)
3/8
|
|
Anmol Choudhary answered |
Understanding the Problem
When tossing an unbiased coin three times, we want to determine the probability of getting exactly two heads.
Possible Outcomes
For three tosses, the sample space consists of:
- HHH
- HHT
- HTH
- HTT
- THH
- THT
- TTH
- TTT
This results in a total of 2^3 = 8 possible outcomes.
Favorable Outcomes
To find the favorable outcomes where exactly two heads appear, we can list them:
- HHT
- HTH
- THH
There are 3 favorable outcomes.
Calculating the Probability
The probability of an event is calculated using the formula:
Probability = (Number of Favorable Outcomes) / (Total Outcomes)
In this case:
- Number of Favorable Outcomes = 3
- Total Outcomes = 8
Thus, the probability of getting exactly two heads is:
Probability = 3 / 8
Conclusion
The correct answer to the probability of getting heads exactly two times when tossing a coin three times is:
- Probability = 3/8
Hence, the correct option is D.
If a constant 60 is subtracted from each of the values of X and Y, then the regression coefficient is- a)reduced by 60
- b)increased by 60
- c)1/60th of the original regression coefficient
- d)not changed
Correct answer is option 'D'. Can you explain this answer?
If a constant 60 is subtracted from each of the values of X and Y, then the regression coefficient is
a)
reduced by 60
b)
increased by 60
c)
1/60th of the original regression coefficient
d)
not changed

|
Crack Gate answered |
The regression coefficient are independent of the change of the origin. But , they are not independent of the change of the scale. It means there will be no effect on the regression coefficient if any constant is subtracted from the values of x and y
∴ After subtracting constant 60 from each value of X and Y, the regression coefficient is not changed.
Given that E and F are events such that P(E) = 0.5, P(F) = 0.4 and P(E∩F) = 0.3, then what will be the value of P(F|E)?- a)2/5
- b)3/5
- c)3/4
- d)2/4
Correct answer is option 'B'. Can you explain this answer?
Given that E and F are events such that P(E) = 0.5, P(F) = 0.4 and P(E∩F) = 0.3, then what will be the value of P(F|E)?
a)
2/5
b)
3/5
c)
3/4
d)
2/4
|
|
Crack Gate answered |
We know that P(F|E) = P(E∩F) / P(E). (By formula for conditional probability)
Value of P(E∩F) is given to be 0.3 and value of P(E) is given to be 0.5.
P(F|E) = (0.3) / (0.5).
P(F|E) = 3 / 5.
Value of P(E∩F) is given to be 0.3 and value of P(E) is given to be 0.5.
P(F|E) = (0.3) / (0.5).
P(F|E) = 3 / 5.
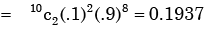
A lot has 10% defective items. Ten items are chosen randomly from this lot. The probability that exactly 2 of the chosen items are defective is - a)0.0036
- b)0.1937
- c)0.2234
- d)0.3874
Correct answer is option 'B'. Can you explain this answer?
A lot has 10% defective items. Ten items are chosen randomly from this lot. The probability that exactly 2 of the chosen items are defective is
a)
0.0036
b)
0.1937
c)
0.2234
d)
0.3874
|
|
Anirudh Banerjee answered |
Let A be the event that items are defective and B be the event that items are non- defective
∴ P( A )= 0.1 and P(B) = 0.9
∴ Probability that exactly two of those items are defective
Let x denote the number of times heads occur in n tosses of a fair coin, If P(x = 4), P(x = 5) and P(x = 6) are in AP, then the value of n is- a)7
- b)10
- c)12
- d)15
Correct answer is option 'A'. Can you explain this answer?
Let x denote the number of times heads occur in n tosses of a fair coin, If P(x = 4), P(x = 5) and P(x = 6) are in AP, then the value of n is
a)
7
b)
10
c)
12
d)
15
|
|
Crack Gate answered |
Clearly, x is a binomial variate with parameters n and p = 1/2 such that
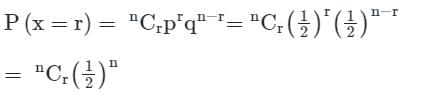
Now, P (x = 4), P(x = 5) and P(x = 6) are in AP.
If a, b, c are in AP then 2b = a+c
∴ 2P (x = 5) = P (x = 4) + P (x = 6)
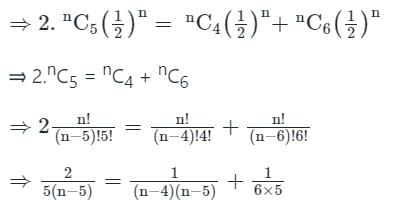
⇒ n2 – 21n + 98 = 0 ⇒ (n – 7) (n – 14) = 0
∴ n = 7 or 14
If the regression line of Y on X is Y = 30 - 0.9X and the standard deviations are Sx = 2 and Sy = 9, then the value of the correlation coefficient rxy is:- a)-0.3
- b)-0.2
- c)0.2
- d)0.3
Correct answer is option 'B'. Can you explain this answer?
If the regression line of Y on X is Y = 30 - 0.9X and the standard deviations are Sx = 2 and Sy = 9, then the value of the correlation coefficient rxy is:
a)
-0.3
b)
-0.2
c)
0.2
d)
0.3
|
|
Crack Gate answered |
The regression line of Y on X is Y = 30 - 0.9x
⇒ Y - 30 = - 0.9x
The regression equation line of Y on X is = y - y1 = r(sy/sx)(x - x1)
Comparing both equations, we get
⇒ r(sy/sx) = -0.9
⇒ r(9/2) = -0.9
⇒ r = (-0/9 × 2)/9 = - 0.2
∴ The value of the correlation coefficient rxy is -0.2
Let x be the mean of squares of first n natural numbers and y be the square of mean of first n natural numbers. If x/y = 55/42 , then what is the value of n ?- a)24
- b)25
- c)27
- d)30
Correct answer is option 'C'. Can you explain this answer?
Let x be the mean of squares of first n natural numbers and y be the square of mean of first n natural numbers. If x/y = 55/42 , then what is the value of n ?
a)
24
b)
25
c)
27
d)
30
|
|
Sanya Agarwal answered |
Concept:
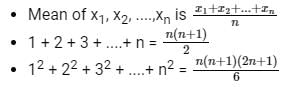
Calculation:
Given: x is the mean of squares of first n natural numbers and y is the square of mean of first n natural numbers
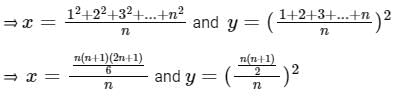
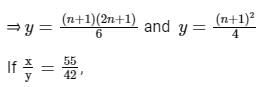
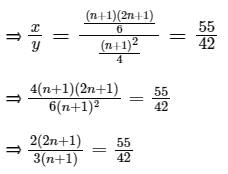
⇒ 2 x 42(2n + 1) = 3 x 55(n + 1)
⇒ 168n + 84 = 165n + 165
⇒ 3n = 81
⇒ n = 27
∴ The correct option is (3).
Calculation:
Given: x is the mean of squares of first n natural numbers and y is the square of mean of first n natural numbers
⇒ 2 x 42(2n + 1) = 3 x 55(n + 1)
⇒ 168n + 84 = 165n + 165
⇒ 3n = 81
⇒ n = 27
∴ The correct option is (3).
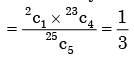
There are 25 calculators in a box. Two of them are defective. Suppose 5 calculators are randomly picked for inspection (i.e., each has the same chance of being selected), what is the probability that only one of the defective calculators will be included in the inspection?- a)1/2
- b)1/3
- c)1/4
- d)1/5
Correct answer is option 'B'. Can you explain this answer?
There are 25 calculators in a box. Two of them are defective. Suppose 5 calculators are randomly picked for inspection (i.e., each has the same chance of being selected), what is the probability that only one of the defective calculators will be included in the inspection?
a)
1/2
b)
1/3
c)
1/4
d)
1/5
|
|
Keerthana Joshi answered |
Probability of only one is defective out of 5 calculators
Consider the following grouped frequency distribution:
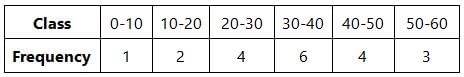 What is the median of the distribution ?
- a)34
- b)34.5
- c)35
- d)35.5
Correct answer is option 'C'. Can you explain this answer?
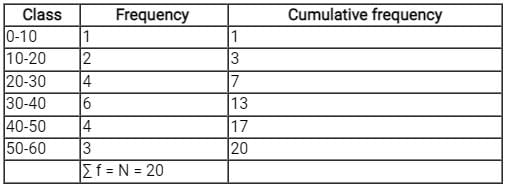
Consider the following grouped frequency distribution:
What is the median of the distribution ?
a)
34
b)
34.5
c)
35
d)
35.5
|
|
Sanvi Kapoor answered |
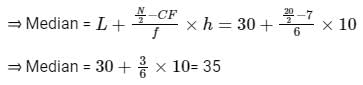
For a distribution, Median
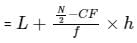
where, L = lower class limit of median class
N = Sum of frequencies
CF = cumulative frequency of class preceding the median class
f = frequency of median class
h = class length of median class.
where, L = lower class limit of median class
N = Sum of frequencies
CF = cumulative frequency of class preceding the median class
f = frequency of median class
h = class length of median class.
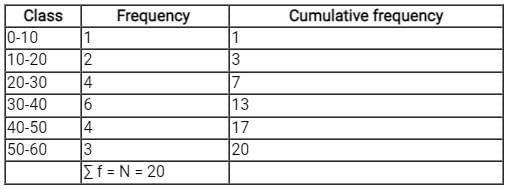
∑f = N = 20
⇒ N/2 = 10
As 7 < 10 < 13, N/2 lies in the class length 30 - 40 by comparing cumulative frequency.
Median class = 30 - 40
⇒ L = 30, N = 60, CF = 7, f = 6, h = 40 - 30 - 10
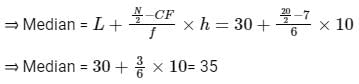
∴ The correct option is (3).
⇒ N/2 = 10
As 7 < 10 < 13, N/2 lies in the class length 30 - 40 by comparing cumulative frequency.
Median class = 30 - 40
⇒ L = 30, N = 60, CF = 7, f = 6, h = 40 - 30 - 10
∴ The correct option is (3).
Dimension reduction methods have the goal of using the correlation structure among the predictor variables to accomplish which of the following:A. To reduce the number of predictor componentsB. To help ensure that these components are dependentC. To provide a framework for interpretability of the resultsD. To help ensure that these components are independentE. To increase the number of predictor componentsChoose the correct answer from the options given below: - a)A, B, D and E only
- b)A, C and D only
- c)A, B, C and E only
- d)B, C, D and E only
Correct answer is option 'B'. Can you explain this answer?
Dimension reduction methods have the goal of using the correlation structure among the predictor variables to accomplish which of the following:
A. To reduce the number of predictor components
B. To help ensure that these components are dependent
C. To provide a framework for interpretability of the results
D. To help ensure that these components are independent
E. To increase the number of predictor components
Choose the correct answer from the options given below:
a)
A, B, D and E only
b)
A, C and D only
c)
A, B, C and E only
d)
B, C, D and E only
|
|
Aarav Kulkarni answered |
Dimension Reduction Methods in Predictor Variables:
Goal:
- The goal of dimension reduction methods is to use the correlation structure among the predictor variables to achieve certain objectives.
Objective:
- The main objective is to reduce the number of predictor components while maintaining the essential information contained in the original dataset.
Benefits:
- By reducing the dimensionality of the data, it becomes easier to analyze and interpret the results.
- It can help in identifying the most significant predictors and removing redundant variables.
- Dimension reduction can also lead to improved model performance by reducing overfitting.
Accomplishments:
- Dimension reduction methods aim to ensure that the components derived are dependent on the correlation structure of the data.
- It helps to maintain the interrelationships between the predictors while reducing the overall dimensionality.
Therefore, the correct answer to the question is option 'B' - Dimension reduction methods aim to reduce the number of predictor components while ensuring that these components are dependent on the correlation structure of the data.
Consider the following grouped frequency distribution: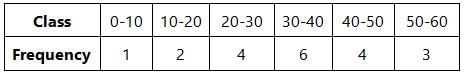 What is mean deviation about the median ?
- a)11.4
- b)11.1
- c)10.8
- d)10.5
Correct answer is option 'D'. Can you explain this answer?
Consider the following grouped frequency distribution:
What is mean deviation about the median ?
a)
11.4
b)
11.1
c)
10.8
d)
10.5
|
|
Engineers Adda answered |
∑f = N = 20
⇒ N/2 = 10
As 7 < 10 < 13, N/2 lies in the class length 30 - 40 by comparing cumulative frequency.
Median class = 30 - 40
⇒ L = 30, N = 60, CF = 7, f = 6, h = 40 - 30 - 10
Now calculating mean deviation about median,
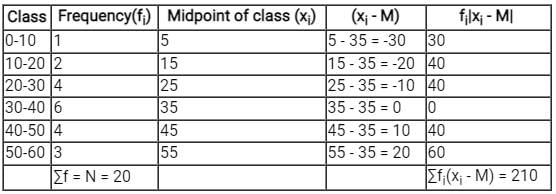
⇒ Mean deviation about median
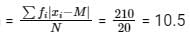
∴ The correct option is (4).
⇒ N/2 = 10
As 7 < 10 < 13, N/2 lies in the class length 30 - 40 by comparing cumulative frequency.
Median class = 30 - 40
⇒ L = 30, N = 60, CF = 7, f = 6, h = 40 - 30 - 10
Now calculating mean deviation about median,
⇒ Mean deviation about median
∴ The correct option is (4).

From a pack of regular from a playing cards, two cards are drawn at random. What is the probability that both cards will be Kings, if first card in NOT replaced - a)1/26
- b)1/52
- c)1/169
- d)1/221
Correct answer is option 'D'. Can you explain this answer?
From a pack of regular from a playing cards, two cards are drawn at random. What is the probability that both cards will be Kings, if first card in NOT replaced
a)
1/26
b)
1/52
c)
1/169
d)
1/221
|
|
Pritam Das answered |
Understanding the Problem
To find the probability of drawing two Kings from a standard deck of playing cards without replacement, we first recognize that a standard deck contains 52 cards, including 4 Kings.
Calculating the Probability
1. First Card Draw
- When the first card is drawn, there are 4 Kings out of 52 total cards.
- The probability of drawing a King first:
- P(King 1) = 4/52
2. Second Card Draw
- After drawing the first King, 51 cards remain in the deck, including 3 Kings.
- The probability of drawing a second King:
- P(King 2 | King 1 drawn) = 3/51
3. Combined Probability
- To find the probability of both events happening (drawing two Kings), we multiply the probabilities of each event:
- P(Both Kings) = P(King 1) * P(King 2 | King 1 drawn)
- P(Both Kings) = (4/52) * (3/51)
Calculating the Final Probability
- P(Both Kings) = (4/52) * (3/51)
- Simplifying:
- = (4 * 3) / (52 * 51)
- = 12 / 2652
- = 1 / 221
Conclusion
The probability that both cards drawn are Kings, given that the first card is not replaced, is indeed 1/221. Hence, the correct answer is option D.
If P(A) = 7/11, P(B) = 6 / 11 and P(A∪B) = 8/11, then P(A|B) = ________
- a)1
- b)2/3
- c)1/2
- d)5/6
Correct answer is option 'D'. Can you explain this answer?
If P(A) = 7/11, P(B) = 6 / 11 and P(A∪B) = 8/11, then P(A|B) = ________
a)
1
b)
2/3
c)
1/2
d)
5/6

|
Bayshore Academy answered |
We know that P(A|B) = P(A∩B) / P(B). (By formula for conditional probability)
Also P(A∪B) = P(A)+P(B) – P(A∩B). (By formula of probability)
⇒ 8/11 = 7/11 + 6/11 – P(A∩B)
⇒ P(A∩B) = 13/11 – 7/11
⇒ P(A∩B) = 6/11
P(A|B) = (6/11) / (6/11).
P(A|B) = 1.
Also P(A∪B) = P(A)+P(B) – P(A∩B). (By formula of probability)
⇒ 8/11 = 7/11 + 6/11 – P(A∩B)
⇒ P(A∩B) = 13/11 – 7/11
⇒ P(A∩B) = 6/11
P(A|B) = (6/11) / (6/11).
P(A|B) = 1.
Analysis of variance is concerned with: - a)Determining change in a dependent variable per unit change in an independent variable
- b)Determining whether a qualitative factor affects the mean of an output variable
- c)Determining whether significant correlation exists between an output variable and an input variable.
- d)Determining whether variance in two or more populations are significantly different.
Correct answer is option 'D'. Can you explain this answer?
Analysis of variance is concerned with:
a)
Determining change in a dependent variable per unit change in an independent variable
b)
Determining whether a qualitative factor affects the mean of an output variable
c)
Determining whether significant correlation exists between an output variable and an input variable.
d)
Determining whether variance in two or more populations are significantly different.
|
|
Debolina Menon answered |
Analysis of variance is used in comparing two or more populations, e.g. Different types of manures for yelding a single crop.
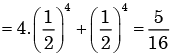
A fair coin is tossed independently four times. The probability of the event “the number of time heads shown up is more than the number of times tails shown up” is - a)1/16
- b)1/8
- c)1/4
- d)5/16
Correct answer is option 'D'. Can you explain this answer?
A fair coin is tossed independently four times. The probability of the event “the number of time heads shown up is more than the number of times tails shown up” is
a)
1/16
b)
1/8
c)
1/4
d)
5/16
|
|
Niharika Iyer answered |
Here we have to find
P(H, H, H, T) + P(H, H, H, H)
If mean and mode of some data are 4 & 10 respectively, its median will be:- a)1.5
- b)5.3
- c)16
- d)6
Correct answer is option 'D'. Can you explain this answer?
If mean and mode of some data are 4 & 10 respectively, its median will be:
a)
1.5
b)
5.3
c)
16
d)
6
|
|
Engineers Adda answered |
Concept:
Mean: The mean or average of a data set is found by adding all numbers in the data set and then dividing by the number of values in the set.
Mode: The mode is the value that appears most frequently in a data set.
Median: The median is a numeric value that separates the higher half of a set from the lower half.
Relation b/w mean, mode and median:
Mode = 3(Median) - 2(Mean)
Calculation:
Given that,
mean of data = 4 and mode of data = 10
We know that
Mode = 3(Median) - 2(Mean)
⇒ 10 = 3(median) - 2(4)
⇒ 3(median) = 18
⇒ median = 6
Hence, the median of data will be 6.
Given that,
mean of data = 4 and mode of data = 10
We know that
Mode = 3(Median) - 2(Mean)
⇒ 10 = 3(median) - 2(4)
⇒ 3(median) = 18
⇒ median = 6
Hence, the median of data will be 6.
If X is a Poisson variate with P(X = 0) = 0.6, then the variance of X is:- a)In (1/5)
- b)log1015
- c)0
- d)ln 15
Correct answer is option 'A'. Can you explain this answer?
If X is a Poisson variate with P(X = 0) = 0.6, then the variance of X is:
a)
In (1/5)
b)
log1015
c)
0
d)
ln 15
|
|
Bayshore Academy answered |
Given
In Poisson distribution
P(X = 0) = 0.6
Formula
Poisson distribution is given by
f(x) = e-λλx/x!
Calculation
P(X = 0) = e-λλ0/0!
⇒ 0.6 = e-λ
⇒ 1/eλ = 6/10 = 3/5
⇒ eλ = 5/3
Taking log on both side
⇒ logeeλ = loge(5/3)
∴ λ = Loge(5/3)
In Standard normal distribution, the value of median is ___________- a)1
- b)0
- c)2
- d)Not fixed
Correct answer is option 'B'. Can you explain this answer?
In Standard normal distribution, the value of median is ___________
a)
1
b)
0
c)
2
d)
Not fixed
|
|
Engineers Adda answered |
In a standard normal distribution the value of mean is o and in normal distribution mean, median and mode coincide.
Normal Distribution is applied for ___________- a)Continuous Random Distribution
- b)Discrete Random Variable
- c)Irregular Random Variable
- d)Uncertain Random Variable
Correct answer is option 'A'. Can you explain this answer?
Normal Distribution is applied for ___________
a)
Continuous Random Distribution
b)
Discrete Random Variable
c)
Irregular Random Variable
d)
Uncertain Random Variable
|
|
Engineers Adda answered |
This is the rule on which Normal distribution is defined, no details on this as of why For more knowledge on this aspect, you can refer to any book or website which speaks on the same.
In Standard normal distribution, the value of mode is ___________- a)2
- b)1
- c)0
- d)Not fixed
Correct answer is option 'C'. Can you explain this answer?
In Standard normal distribution, the value of mode is ___________
a)
2
b)
1
c)
0
d)
Not fixed
|
|
Engineers Adda answered |
In a standard normal distribution, the value of mean is 0 and in normal distribution mean and mode coincide.
In Normal distribution, the highest value of ordinate occurs at ___________- a)Mean
- b)Variance
- c)Extremes
- d)Same value occurs at all points
Correct answer is option 'A'. Can you explain this answer?
In Normal distribution, the highest value of ordinate occurs at ___________
a)
Mean
b)
Variance
c)
Extremes
d)
Same value occurs at all points
|
|
Crack Gate answered |
This is due the behaviour of the pdf of Normal distribution.
A box contains 10 screws, 3 of which are defective. Two screws are drawn at random with replacement. The probability that none of the two screws is defective will be - a)100%
- b)50%
- c)47%
- d)49%
Correct answer is option 'D'. Can you explain this answer?
A box contains 10 screws, 3 of which are defective. Two screws are drawn at random with replacement. The probability that none of the two screws is defective will be
a)
100%
b)
50%
c)
47%
d)
49%
|
|
Sanya Agarwal answered |
A = First drawn screw non-defective.
B = Second drawn screw non-defective.
P(A) = 7/10
Because 7 out of 10 screws are non-defective and we sample at random,
P(B) = 7/10
The second drawing is the same as the beginning.
P(A Intersection B) = P(A) * P(B) = 0.7 * 0.7 = 0.49
It is Converted to percentage = 0.49 * 100 = 49%
The probability of two screws are defective is 49%.
The correlation coefficient between two variables X and Y is 0.4. The correlation coefficient between 2X and (-Y) will be:- a)0.4
- b)-0.8
- c)-0.4
- d)0.8
Correct answer is option 'C'. Can you explain this answer?
The correlation coefficient between two variables X and Y is 0.4. The correlation coefficient between 2X and (-Y) will be:
a)
0.4
b)
-0.8
c)
-0.4
d)
0.8
|
|
Crack Gate answered |
Given
The correlation coefficient between two variables X and Y = 0.4
Concept used
The correlation coefficient (r) is independent of origin and scale and depend on the sign of variables
Calculation
The correlation coefficient between the two variables is the measure of the slope between the variables in the regression graph. It is given that the correlation coefficient between X and Y is 0.4 and the correlation coefficient is independent of change of origin and scale but it depends on variables
∴ The correlation coefficient between 2X and (-Y) is - 0.4
Important Points:
The value of simple correlation coefficient in the interval of [-1, 1]
The regression coefficient is independent of the change of origin. But, they are not independent of the change of the scale. It means there will be no effect on the regression coefficient if any constant is subtracted from the values of x and y
An experiment consists of tossing a coin 20 times. Such an experiment is performed 50 times. The number of heads and the number of tails in each experiment are noted. What is the correlation coefficient between the two?- a)-1
- b)-20/50
- c)20/50
- d)1
Correct answer is option 'A'. Can you explain this answer?
An experiment consists of tossing a coin 20 times. Such an experiment is performed 50 times. The number of heads and the number of tails in each experiment are noted. What is the correlation coefficient between the two?
a)
-1
b)
-20/50
c)
20/50
d)
1

|
Swati Patel answered |
Correlation Coefficient between number of heads and tails in the experiment
To find the correlation coefficient between the number of heads and the number of tails in the experiment, we need to calculate the covariance and the standard deviations of the two variables.
Step 1: Calculate the mean
First, we need to calculate the mean of the number of heads and the number of tails.
Let's say the mean number of heads is denoted by μh and the mean number of tails is denoted by μt.
Step 2: Calculate the covariance
Next, we calculate the covariance between the number of heads and the number of tails using the formula:
Covariance (X, Y) = Σ((X - μx)(Y - μy))/(n-1)
Where X and Y are the variables (number of heads and number of tails), μx and μy are the means of the variables, and n is the number of observations.
Step 3: Calculate the standard deviations
We also need to calculate the standard deviations of the number of heads and the number of tails using the formula:
Standard Deviation (X) = √(Σ(X - μx)²/(n-1))
Where X is the variable (number of heads or number of tails), μx is the mean of the variable, and n is the number of observations.
Step 4: Calculate the correlation coefficient
Finally, we can calculate the correlation coefficient using the formula:
Correlation Coefficient = Covariance (X, Y) / (Standard Deviation (X) * Standard Deviation (Y))
Applying the steps to the given data
In this case, we have performed the experiment 50 times, each with 20 tosses of a coin. So, the number of observations (n) is 50.
Let's assume that in a single experiment, the average number of heads is 10 (μh = 10) and the average number of tails is also 10 (μt = 10).
Now, we can apply the formulas to calculate the covariance, standard deviations, and the correlation coefficient.
After the calculations, we find that the covariance is negative, i.e., Covariance (X, Y) = -20.
The standard deviation of the number of heads is 2.82, and the standard deviation of the number of tails is also 2.82.
Finally, we can calculate the correlation coefficient:
Correlation Coefficient = -20 / (2.82 * 2.82) = -20/7.9644
Simplifying further, we get the correlation coefficient as approximately -2.51.
Therefore, the correct answer is option A) -1.
Two dices are rolled simultaneously. The probability that the sum of digits on the top surface of the two dices is even, is - a)0.5
- b)0.25
- c)0.167
- d)0.125
Correct answer is option 'A'. Can you explain this answer?
Two dices are rolled simultaneously. The probability that the sum of digits on the top surface of the two dices is even, is
a)
0.5
b)
0.25
c)
0.167
d)
0.125
|
|
Dipika Bose answered |
Here sample space S= 6 × 6 = 36
Total no. of way in which sum of digits on the top surface of the two dice is is even is 18.
∴ The require probability = 0.5
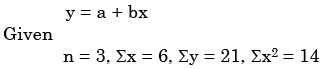
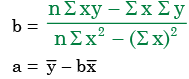
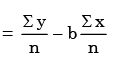
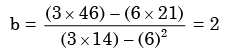
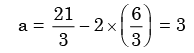
Three values of x and y are to be fitted in a straight line in the form y = a + bx by the method of least squares. GivenΣx = 6, Σy = 21, Σx2 = 14 and Σxy = 46, the values of a and b are respectively. - a)2 and 3
- b)1 and 2
- c)2 and 1
- d)3 and 2
Correct answer is option 'D'. Can you explain this answer?
Three values of x and y are to be fitted in a straight line in the form y = a + bx by the method of least squares. GivenΣx = 6, Σy = 21, Σx2 = 14 and Σxy = 46, the values of a and b are respectively.
a)
2 and 3
b)
1 and 2
c)
2 and 1
d)
3 and 2

|
Ritika Menon answered |

Given that E and F are events such that P(E) = 0.6, P(F) = 0.3 and P(E∩F) = 0.2, then P(E|F) ?- a)2/3
- b)1/3
- c)3/4
- d)1/4
Correct answer is option 'A'. Can you explain this answer?
Given that E and F are events such that P(E) = 0.6, P(F) = 0.3 and P(E∩F) = 0.2, then P(E|F) ?
a)
2/3
b)
1/3
c)
3/4
d)
1/4
|
|
Abhay Banerjee answered |
Solution:
Given data:
- P(E) = 0.6
- P(F) = 0.3
- P(E ∩ F) = 0.2
Calculating P(E|F):
To find the conditional probability P(E|F), we use the formula:
P(E|F) = P(E ∩ F) / P(F)
Substitute the given values into the formula:
P(E|F) = 0.2 / 0.3
P(E|F) = 2/3
Therefore, the correct answer is option 'a) 2/3'.
Given data:
- P(E) = 0.6
- P(F) = 0.3
- P(E ∩ F) = 0.2
Calculating P(E|F):
To find the conditional probability P(E|F), we use the formula:
P(E|F) = P(E ∩ F) / P(F)
Substitute the given values into the formula:
P(E|F) = 0.2 / 0.3
P(E|F) = 2/3
Therefore, the correct answer is option 'a) 2/3'.
If three coins are tossed simultaneously, the probability of getting at least one head is - a)1/8
- b)3/8
- c)1/2
- d)7/8
Correct answer is option 'D'. Can you explain this answer?
If three coins are tossed simultaneously, the probability of getting at least one head is
a)
1/8
b)
3/8
c)
1/2
d)
7/8

|
Pallabi Kulkarni answered |
Understanding the Problem
When tossing three coins, we want to find the probability of getting at least one head.
Sample Space
The sample space (all possible outcomes) when tossing three coins is:
- HHH
- HHT
- HTH
- HTT
- THH
- THT
- TTH
- TTT
This gives us a total of 2^3 = 8 outcomes.
Calculating Desired Outcomes
To find the probability of getting at least one head, it's often easier to calculate the probability of the complementary event — getting no heads (i.e., all tails).
- The only outcome for no heads is: TTT
Thus, there is 1 outcome where we get no heads.
Probability of No Heads
The probability of getting no heads (all tails) is:
- P(no heads) = Number of favorable outcomes for no heads / Total outcomes = 1/8
Calculating Probability of At Least One Head
Now, we can find the probability of getting at least one head:
- P(at least one head) = 1 - P(no heads) = 1 - 1/8 = 7/8
Final Answer
Thus, the probability of getting at least one head when tossing three coins is:
- 7/8
Therefore, the correct answer is option 'D'.
Consider an unbiased cubic dice with opposite faces coloured identically and each face coloured red, blue or green such that each colour appears only two times on the dice. If the dice is thrown thrice, the probability of obtaining red colour on top face of the dice at least twice is _______- a)7/27
- b)10/127
- c)19/27
- d)1/3
Correct answer is option 'A'. Can you explain this answer?
Consider an unbiased cubic dice with opposite faces coloured identically and each face coloured red, blue or green such that each colour appears only two times on the dice. If the dice is thrown thrice, the probability of obtaining red colour on top face of the dice at least twice is _______
a)
7/27
b)
10/127
c)
19/27
d)
1/3
|
|
Crack Gate answered |
Concept:
Binomial distribution
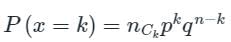
where
p = Probability of success in one trial
q = Probability of failure in one trial = 1 – p
n = Total number of independent trials
k = Discrete random variable
Calculation:
n = 3
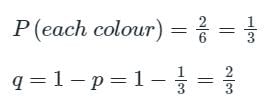
Using binomial distribution
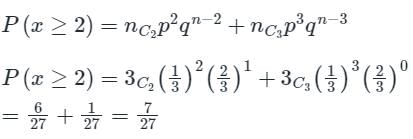
Probability of getting red on the top face at least twice is
P(x ≥ 2) = P(x = 2) + P(x = 3)
What is the mean of the range, mode and median of the data given below?5, 10, 3, 6, 4, 8, 9, 3, 15, 2, 9, 4, 19, 11, 4- a)1
- b)12
- c)8
- d)9
Correct answer is option 'D'. Can you explain this answer?
What is the mean of the range, mode and median of the data given below?
5, 10, 3, 6, 4, 8, 9, 3, 15, 2, 9, 4, 19, 11, 4
a)
1
b)
12
c)
8
d)
9
|
|
Engineers Adda answered |
Given:
The given data is 5, 10, 3, 6, 4, 8, 9, 3, 15, 2, 9, 4, 19, 11, 4
The given data is 5, 10, 3, 6, 4, 8, 9, 3, 15, 2, 9, 4, 19, 11, 4
Concept used:
The mode is the value that appears most frequently in a data set
At the time of finding Median
First, arrange the given data in the ascending order and then find the term
The mode is the value that appears most frequently in a data set
At the time of finding Median
First, arrange the given data in the ascending order and then find the term
Formula used:
Mean = Sum of all the terms/Total number of terms
Median = {(n + 1)/2}th term when n is odd
Median = 1/2[(n/2)th term + {(n/2) + 1}th] term when n is even
Range = Maximum value – Minimum value
Mean = Sum of all the terms/Total number of terms
Median = {(n + 1)/2}th term when n is odd
Median = 1/2[(n/2)th term + {(n/2) + 1}th] term when n is even
Range = Maximum value – Minimum value
Calculation:
Arranging the given data in ascending order
2, 3, 3, 4, 4, 4, 5, 6, 8, 9, 9, 10, 11, 15, 19
Here, Most frequent data is 4 so
Mode = 4
Total terms in the given data, (n) = 15 (It is odd)
Median = {(n + 1)/2}th term when n is odd
⇒ {(15 + 1)/2}th term
⇒ (8)th term
⇒ 6
Now, Range = Maximum value – Minimum value
⇒ 19 – 2 = 17
Mean of Range, Mode and median = (Range + Mode + Median)/3
⇒ (17 + 4 + 6)/3
⇒ 27/3 = 9
∴ The mean of the Range, Mode and Median is 9
Chapter doubts & questions for Probability and Statistics - Engineering Mathematics for Electronics & Communication Engg 2025 is part of Electronics and Communication Engineering (ECE) exam preparation. The chapters have been prepared according to the Electronics and Communication Engineering (ECE) exam syllabus. The Chapter doubts & questions, notes, tests & MCQs are made for Electronics and Communication Engineering (ECE) 2025 Exam. Find important definitions, questions, notes, meanings, examples, exercises, MCQs and online tests here.
Chapter doubts & questions of Probability and Statistics - Engineering Mathematics for Electronics & Communication Engg in English & Hindi are available as part of Electronics and Communication Engineering (ECE) exam.
Download more important topics, notes, lectures and mock test series for Electronics and Communication Engineering (ECE) Exam by signing up for free.
Engineering Mathematics for Electronics & Communication Engg
53 videos|110 docs|59 tests
|
|
© EduRev
|
Education Revolution
|


|


Signup to see your scores
go up
within 7 days!
within 7 days!
Takes less than 10 seconds to signup